U.S. milk production has been coming in lower than forecast during 2023, and that has primarily been due to weak milk production per cow. Annual milk production per cow (PPC) growth used to average around 1.5%.
The long-run growth is driven by constantly improving genetics and better management techniques and facilities, including a better understanding of how to keep cows comfortable and how to feed them in the most efficient way to support higher milk production. We would see PPC fluctuate at times due to milk prices, feed costs, and weather events, but we followed a nice trend higher driven by the long-run improvements we were making in the herd, equipment, and knowledge.
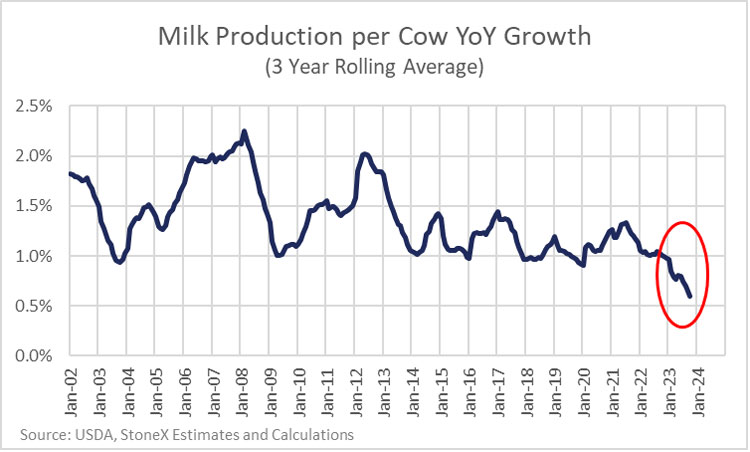
The growth rate for PPC shifted lower around 2014, and we averaged just 1.1% yearly growth between 2014 and 2022. I believe this was primarily driven by a change in the type of cows that were being milked. The industry was shifting from primarily Holstein cows to more Jersey and Holstein-Jersey crossbred animals. The Jerseys and crosses are smaller animals that are a little more efficient at turning feed into milk. They produce fewer pounds of milk, but the amount of fat and protein in the milk is typically higher than Holsteins. Most dairy farmers in the U.S. are now being paid based on the actual amount of fat and protein in their milk, not on the pounds of liquid they produce, so there has been an incentive to boost the components in the milk.
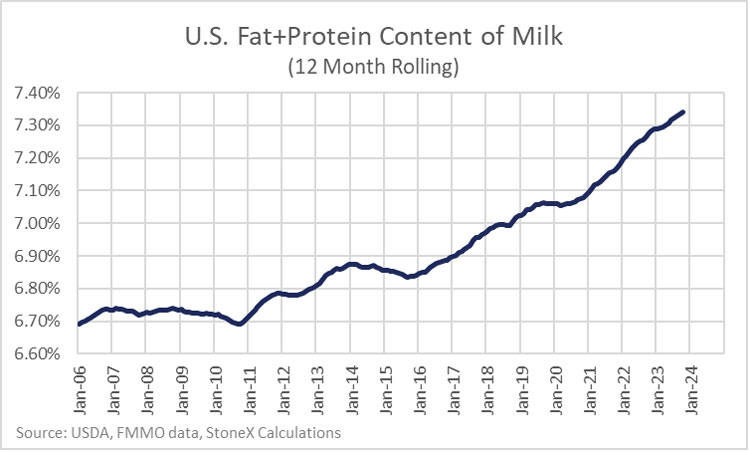
One note on my data is that the protein content I’m using is the protein content in multiple component (MCP) federal milk marketing orders, where the protein content is likely higher than the other orders. I think the national average combined fat and protein content is likely lower than what is shown in the graph, but I speculate that the upward trend in protein content in non-MCP orders is similar to the MCP orders (maybe a little less steep), given that the fat content in non-MCP is following a similar trend as MCP orders.
Solids per cow seeing steady growth
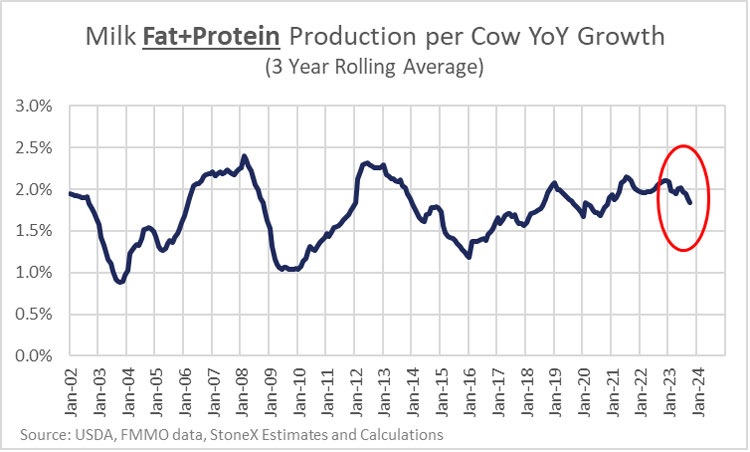
Instead of looking at milk production per cow, what if we look at milk solids (combined fat and protein) produced per cow? The average growth in solids per cow from 2002 to 2013 was 1.7% per year while the average growth from 2014 to 2023 has been 1.8%. So, the growth in the amount of fat and protein that we are getting out of each cow has been roughly steady over the past two decades, unlike the growth in the pounds of milk that we’re getting.
What does it mean? It probably means a lot of things, but from my perspective, it means our expectations and forecasts for milk production from USDA need to shift lower. In the monthly Milk Production report released by USDA, they do not report the fat and protein content of the milk, only the pounds of milk. Historically, the rule of thumb was that milk production growth of 1.5% was “normal” growth. If production was above that level, it would be a little bearish for the market, and if production was below that, it was supportive for the market. The issue now is that with the weaker growth in production per cow, we might need to shift our rule of thumb down to something around 1% being normal, or the industry needs to start watching the combined fat and protein production more closely instead of just the headline milk production number.