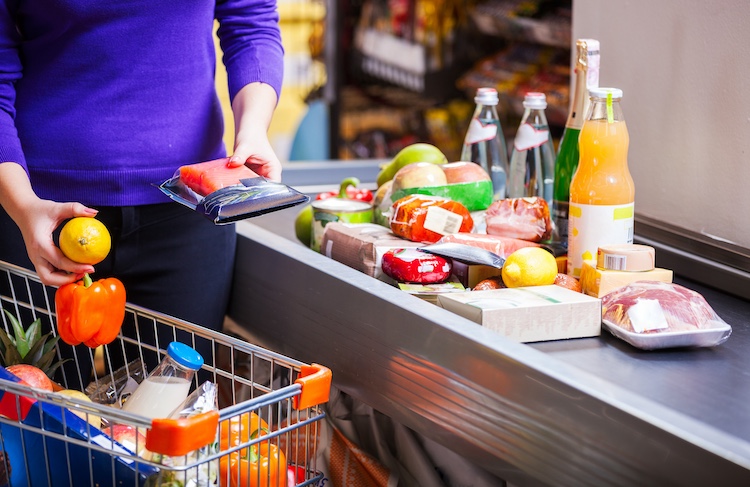
People are feeling the pinch these days as they head to the grocery store and notice higher prices on some of their favorite items and the necessities. While we are fortunate to live in a country with an ample supply of affordable food, budgets get stretched when prices go up. The U.S. Department of Agriculture (USDA) tracks how much food prices have changed over time.
“Food is a necessity as well as a major expenditure category for households,” said Megan Sweitzer, an agricultural economist with the USDA Economic Research Service. While Americans spend less of their annual income on food than people in many other countries, it is the third largest spending category following housing and transportation. In 2022, 12.8% of total household spending went toward food. Sweitzer said the household share of spending on food has actually gone down over the past few decades, though.
Food prices in December 2023 were not much different than those in December 2022, but when looking at the annual average for food prices between the two years, there was a 5.8% jump in food prices in 2023. This includes food eaten at home and away from the home.
Although 5.8% was the second highest annual change in the past two decades, Sweitzer said the growth tempered considerably from 2022, when prices rose by 9.9%.
Breaking it down further, money spent on food eaten at home rose by 5%. This was still on the higher end of price growth for the past few decades, Sweitzer noted, but prices moderated from 2022 when they leaped by 11.4%. She explained that prices for food eaten at home have more volatility year to year than food eaten away from home, which typically experiences consistent growth.
That was the case in 2023, when prices for food away from home climbed 7.1%. This was similar to the 7.7% bump experienced in 2022. In 2023, food eaten away from home represented 40% of the dollars spent on food.
For money spent on groceries in 2023, close to 12% went toward meat. Fruits and vegetables accounted for 10.4%. Cereal and bakery products represented 7.9%, and 7.6% was spent on nonalcoholic beverages. The dairy category was 5.5% of food expenditures, while a category called other foods — which includes eggs, fats and oils, prepared foods, baby foods, and such — was 17.1%.
As far as food spending for this year, Sweitzer explained that USDA’s prediction intervals for food prices start wide and narrow as more data becomes available. Right now, food prices are expected to increase moderately by 1.3% in 2024. Food at home is forecast to decline just a bit, down 0.4%, while food away from home could rise by 4.7%. Sweitzer noted that there is high uncertainty in some categories, such as eggs and meat, that could move these predictions.


