Laboski is an extension soil fertility specialist at the University of Wisconsin-Madison and Clark is an extension crops and soils agent in Chippewa and Eau Claire County, Wis. The survey reported in this article was funded by the Midwest Forage Association. It was made possible by the work of many University of Wisconsin-Extension faculty and staff.
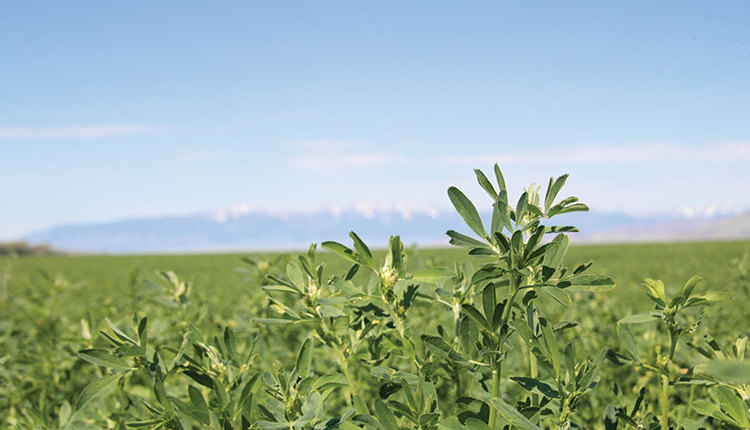
Sulfur (S) and potassium (K) are two nutrients that alfalfa growers should watch based on alfalfa plant analysis surveys conducted last year by University of Wisconsin specialists. In their field research, specialists collected samples from the top 6 inches when the crop was in the bud to first-flower stage.
In all, 39 samples were collected from 19 Wisconsin counties, with 37 samples collected prior to first cutting (May 19 to June 10) and two collected prior to second cutting (June 28 to July 13). Tissue S concentrations were considered low in 88 percent of these samples (less than 0.25 percent S). Likewise, K concentrations were found to be low in 75 percent of the samples (less than 2.25 percent K). Eight of the samples came from fields, or portions of fields, that were poor in appearance as noted by a lighter green color and by a shorter and even stunted crop. Meanwhile, a vast majority of samples (31 of 39) came from fields that appeared normal.
In normal-appearing fields, tissue S levels were low in 58 percent of the samples, while K levels were low in 45 percent of the cases. For all samples submitted, 64 percent were low in S, 51 percent were low in K, and 31 percent were low in both S and K.
The range in tissue S concentrations was 0.11 to 0.34 percent, while K ranged from 1.50 to 3.16 percent. Other tissue nutrient concentrations did not suggest widespread deficiencies, though boron (B) was low in 10 percent of samples.
Costs drive K deficiency
The results of this plant analysis survey are not entirely surprising. As potash fertilizer prices have remained elevated for several years, growers in Wisconsin, and likely many other regions in the U.S., have applied less potash. As this occurs, potassium deficiency results because more K is removed in the harvested crop compared to what has been applied in manure or fertilizer. As a thumb rule, approximately 60 pounds of K2O is removed for every ton of harvested dry matter.
If soil test K levels are very high, then declining soil test K levels are not as big of a problem for crop production, provided the grower recognizes that at some point in time they will need to resume K applications as fertilizer or manure. However, if soil test K levels are optimum or lower, then reducing soil test K levels further may result in problems such as reduced yield and/or poor winter survival. Soil testing every three to four years and following recommendations for K applications is the best way to ensure that K does not limit alfalfa production.
Sulfur now a need
In a plant analysis survey conducted in 2000 and 2001, S was low in 38 percent of the alfalfa fields sampled in Wisconsin (Kelling et al., 2002). A short decade later, 64 percent of all the alfalfa fields sampled in 2010 were considered low in S.
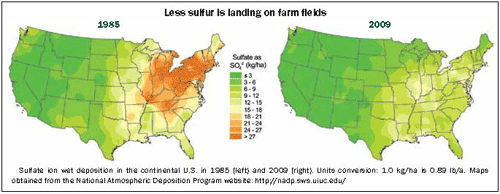
The large jump in potential S deficiency is likely attributable to reduced atmospheric deposition of sulfate-S since enactment of the Clean Air Act. Atmospheric deposition has been a historically significant source of S for Wisconsin.
The maps show how much atmospheric S deposition has been reduced from 1985 through 2009. Recently, S deficiency was diagnosed in some alfalfa fields in Iowa (Lang et al., 2006). Based on these maps, finding alfalfa fields in Wisconsin with low tissue S concentrations is not surprising. However, the large percentage of samples with tissue S concentrations below 0.25 percent, and which otherwise appeared normal, is surprising.
Manure and soil organic matter are other significant sources of S for crop production. Manure was last applied more than five years ago on 31 percent of all fields sampled, while 26 percent of fields had manure applied within the last crop year. There was no significant difference in tissue S concentration based on years since the last manure application.
There was also no significant relationship between soil organic matter content and tissue sulfur content. At this time, prediction of S deficiency continues to be best done with plant sampling.
To test for sulfur
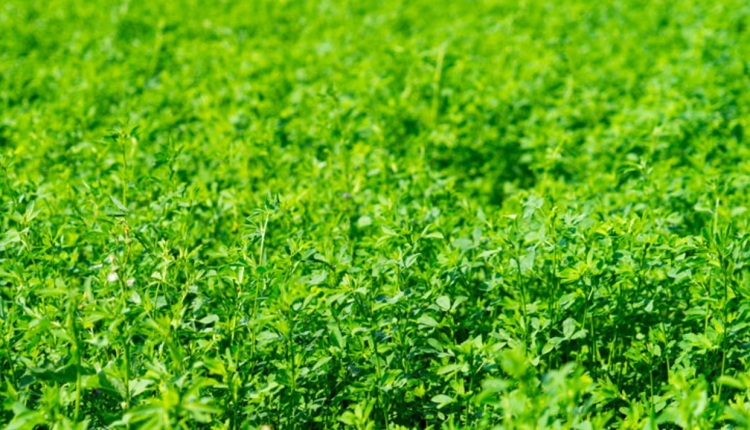
Lighter green, stunted, and spindlier plants with delayed maturity and thin stands characterize sulfur deficiency in alfalfa. If S deficiency is suspected, then tissue samples can be collected to determine the crops S status.
Tissue samples should be collected from the top 6 inches of 30 to 40 plants that are at the bud to first-flower growth stage and composited into one sample. Samples can be taken prior to any cutting. However, if S deficiency is found earlier in the growing season, then fertilizer applications can be made earlier, and yield will improve.
Tissues samples should be placed in paper envelopes after any soil or dust is brushed off and submitted to a soil-testing laboratory. It is best to contact the laboratory prior to sample submission to verify sample-handling procedures and confirm that the laboratory analyzes plant samples. Soil samples, collected at the same times as plant samples, can be useful in interpreting plant analysis results for phosphorus and K.
Plant samples that test less than 0.23 percent S will likely benefit from an application of 25 pounds of S per acre in a sulfate form. Samples that test 0.23 to 0.24 percent may also respond to fertilizer applications. A profitable response to S fertilizer is not expected if tissue S is 0.25 percent or greater.
Fertilizer should be applied immediately after cutting before there is substantial regrowth to prevent injuring the regrowth with wheel traffic. If the grower would like to confirm a yield response to S, then fertilizer may be applied to field length strips or even small 10-foot by 10-foot areas (Lang et al., 2006). Visual responses to fertilizer, such as greenness and crop height, can be compared to untreated areas. It may take four weeks before visual responses can be seen and will be dependent upon soil moisture and temperature.
If a grower would like to test for S response in a 10-foot by 10-foot area, then one-third pound of calcium sulfate (18 percent S) or one-quarter pound of ammonium sulfate (24 percent S) can be applied to the 100-square-foot area.
In summary, S and K are two key nutrients that alfalfa growers should pay attention to improve yield. Neglecting K applications on soils testing low or optimum may reduce soil test K levels further and lead to production problems in alfalfa and rotational crops. Atmospheric deposition of S is falling, and high-demand crops such as alfalfa may require additional fertilizer or manure S to ensure high yields.
The experience in this survey was specific to Wisconsin; however, low S and/or K can be problems in other regions, as well. The alfalfa plant analysis survey will continue this year. If Wisconsin growers are interested in participating by having a field sampled and providing detailed field history, then they should contact their county extension office.
Click here to return to the Crops & Forages E-Sources 1106_414
Sulfur (S) and potassium (K) are two nutrients that alfalfa growers should watch based on alfalfa plant analysis surveys conducted last year by University of Wisconsin specialists. In their field research, specialists collected samples from the top 6 inches when the crop was in the bud to first-flower stage.
In all, 39 samples were collected from 19 Wisconsin counties, with 37 samples collected prior to first cutting (May 19 to June 10) and two collected prior to second cutting (June 28 to July 13). Tissue S concentrations were considered low in 88 percent of these samples (less than 0.25 percent S). Likewise, K concentrations were found to be low in 75 percent of the samples (less than 2.25 percent K). Eight of the samples came from fields, or portions of fields, that were poor in appearance as noted by a lighter green color and by a shorter and even stunted crop. Meanwhile, a vast majority of samples (31 of 39) came from fields that appeared normal.
In normal-appearing fields, tissue S levels were low in 58 percent of the samples, while K levels were low in 45 percent of the cases. For all samples submitted, 64 percent were low in S, 51 percent were low in K, and 31 percent were low in both S and K.
The range in tissue S concentrations was 0.11 to 0.34 percent, while K ranged from 1.50 to 3.16 percent. Other tissue nutrient concentrations did not suggest widespread deficiencies, though boron (B) was low in 10 percent of samples.

Costs drive K deficiency
The results of this plant analysis survey are not entirely surprising. As potash fertilizer prices have remained elevated for several years, growers in Wisconsin, and likely many other regions in the U.S., have applied less potash. As this occurs, potassium deficiency results because more K is removed in the harvested crop compared to what has been applied in manure or fertilizer. As a thumb rule, approximately 60 pounds of K2O is removed for every ton of harvested dry matter.
If soil test K levels are very high, then declining soil test K levels are not as big of a problem for crop production, provided the grower recognizes that at some point in time they will need to resume K applications as fertilizer or manure. However, if soil test K levels are optimum or lower, then reducing soil test K levels further may result in problems such as reduced yield and/or poor winter survival. Soil testing every three to four years and following recommendations for K applications is the best way to ensure that K does not limit alfalfa production.
Sulfur now a need
In a plant analysis survey conducted in 2000 and 2001, S was low in 38 percent of the alfalfa fields sampled in Wisconsin (Kelling et al., 2002). A short decade later, 64 percent of all the alfalfa fields sampled in 2010 were considered low in S.
The large jump in potential S deficiency is likely attributable to reduced atmospheric deposition of sulfate-S since enactment of the Clean Air Act. Atmospheric deposition has been a historically significant source of S for Wisconsin.
The maps show how much atmospheric S deposition has been reduced from 1985 through 2009. Recently, S deficiency was diagnosed in some alfalfa fields in Iowa (Lang et al., 2006). Based on these maps, finding alfalfa fields in Wisconsin with low tissue S concentrations is not surprising. However, the large percentage of samples with tissue S concentrations below 0.25 percent, and which otherwise appeared normal, is surprising.
Manure and soil organic matter are other significant sources of S for crop production. Manure was last applied more than five years ago on 31 percent of all fields sampled, while 26 percent of fields had manure applied within the last crop year. There was no significant difference in tissue S concentration based on years since the last manure application.
There was also no significant relationship between soil organic matter content and tissue sulfur content. At this time, prediction of S deficiency continues to be best done with plant sampling.
To test for sulfur
Lighter green, stunted, and spindlier plants with delayed maturity and thin stands characterize sulfur deficiency in alfalfa. If S deficiency is suspected, then tissue samples can be collected to determine the crops S status.
Tissue samples should be collected from the top 6 inches of 30 to 40 plants that are at the bud to first-flower growth stage and composited into one sample. Samples can be taken prior to any cutting. However, if S deficiency is found earlier in the growing season, then fertilizer applications can be made earlier, and yield will improve.
Tissues samples should be placed in paper envelopes after any soil or dust is brushed off and submitted to a soil-testing laboratory. It is best to contact the laboratory prior to sample submission to verify sample-handling procedures and confirm that the laboratory analyzes plant samples. Soil samples, collected at the same times as plant samples, can be useful in interpreting plant analysis results for phosphorus and K.
Plant samples that test less than 0.23 percent S will likely benefit from an application of 25 pounds of S per acre in a sulfate form. Samples that test 0.23 to 0.24 percent may also respond to fertilizer applications. A profitable response to S fertilizer is not expected if tissue S is 0.25 percent or greater.
Fertilizer should be applied immediately after cutting before there is substantial regrowth to prevent injuring the regrowth with wheel traffic. If the grower would like to confirm a yield response to S, then fertilizer may be applied to field length strips or even small 10-foot by 10-foot areas (Lang et al., 2006). Visual responses to fertilizer, such as greenness and crop height, can be compared to untreated areas. It may take four weeks before visual responses can be seen and will be dependent upon soil moisture and temperature.
If a grower would like to test for S response in a 10-foot by 10-foot area, then one-third pound of calcium sulfate (18 percent S) or one-quarter pound of ammonium sulfate (24 percent S) can be applied to the 100-square-foot area.
In summary, S and K are two key nutrients that alfalfa growers should pay attention to improve yield. Neglecting K applications on soils testing low or optimum may reduce soil test K levels further and lead to production problems in alfalfa and rotational crops. Atmospheric deposition of S is falling, and high-demand crops such as alfalfa may require additional fertilizer or manure S to ensure high yields.
The experience in this survey was specific to Wisconsin; however, low S and/or K can be problems in other regions, as well. The alfalfa plant analysis survey will continue this year. If Wisconsin growers are interested in participating by having a field sampled and providing detailed field history, then they should contact their county extension office.


