The author is extension agronomist, University of Wisconsin, Madison.
Relative forage quality (RFQ) is the new standard to measure alfalfa quality. It replaces Relative Feed Value (RFV) which was a good tool in ranking forages for sale, inventorying, or assigning forage to animal groups according to their quality needs.
RFV is calculated from both ADF (acid detergent fiber) and NDF (neutral detergent fiber). Those two measurements can then estimate energy intake. Meanwhile, relative forage quality (RFQ) is calculated from NDF and fiber digestibility known specifically as neutral detergent fiber digestibility - NDFD. RFQ estimates energy content for grass-legume mixes using the summative equations for total digestible nutrients recommended by the National Research Council. Those equations are based on feeding dairy animals (and earlier for feeding beef) and adjusts intake based on digestible fiber.
Simply more accurate
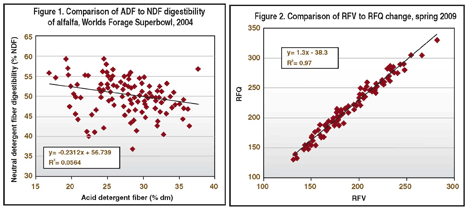
RFV used acid detergent fiber to estimate digestible dry matter as has been the industry standard for the last 40 years. When using any fiber determination to estimate digestibility, the assumption is made that there is a close relationship between fiber concentration and digestibility. This is definitely not true for ADF content of alfalfa shown in Figure 1. It clearly shows the relationship between ADF and NDF digestibility varies for pure alfalfa samples from the Worlds Forage Superbowl. RFV and RFQ are the same for alfalfa when fiber digestibility is average. They differ primarily as fiber digestibility varies from average.
We have used forage quality sticks for several years to estimate when to take first-cutting alfalfa based on RFV. Since RFQ is a better estimate of forage quality than RFV, we wondered if there was any thumb rule to compare Relative Forage Quality to Relative Feed Value?

During the springs of 2006, 2007, and 2009, we conducted a study to determine the rate of alfalfa forage quality change during spring growth. In particular, the interest was in the rate of digestible fiber change and the relationship of RFV to RFQ rates of change.
The study consisted of repeated samplings of alfalfa from multiple sites in Wisconsin and Minnesota. Sampling took place between May 15 and June 20.
The average rates of change of several forage quality components are presented in the table above. Generally, the rate of quality change was slightly less in 2006 than 2007 or 2009. It should also be noted that the rate of forage quality change in 2006 was higher within each location than the overall average indicates. So the actual rates of change within a location were more similar among years than the table indicates.
When we compared changes in RFV and RFQ during the 2009 spring greenup, we found a very highly correlated (average 0.97) linear relationship each year as shown in Figure 2. Also, as expected, the decline of RFQ change per day was greater than the decline of RFV per day. This is due to the fact that RFQ rate of change is composed of both the NDF rate of change (which is a responsible for the RFV rate of change) and the fiber digestibility (NDFD) rate of change. Overall relationship was very consistent with RFQ change averaging 1.3 times RFV.
Generally, digestible fiber of alfalfa is higher than average on first cutting but it declines at a linear rate as fiber is building. The major difference among years is the bias (how much higher than average digestible fiber is). Thus, we can convert RFV (from forage quality sticks) to RFQ by determining digestible fiber (and RFQ) on one sample in the early spring and calculating the bias used to adjust all other RFV readings.
To calculate bias from sample analysis results use the formula:
Bias = RFQ – (1.3*RFV)
Then, to convert RFV readings (for example, from a forage quality stick) to RFQ, multiply RFV by 1.3 and add bias according to the following:
RFQ = (RFV * 1.3) + Bias
Click here to return to the Crops & Forages E-Sources
100425_297
Relative forage quality (RFQ) is the new standard to measure alfalfa quality. It replaces Relative Feed Value (RFV) which was a good tool in ranking forages for sale, inventorying, or assigning forage to animal groups according to their quality needs.
RFV is calculated from both ADF (acid detergent fiber) and NDF (neutral detergent fiber). Those two measurements can then estimate energy intake. Meanwhile, relative forage quality (RFQ) is calculated from NDF and fiber digestibility known specifically as neutral detergent fiber digestibility - NDFD. RFQ estimates energy content for grass-legume mixes using the summative equations for total digestible nutrients recommended by the National Research Council. Those equations are based on feeding dairy animals (and earlier for feeding beef) and adjusts intake based on digestible fiber.
Simply more accurate
RFV used acid detergent fiber to estimate digestible dry matter as has been the industry standard for the last 40 years. When using any fiber determination to estimate digestibility, the assumption is made that there is a close relationship between fiber concentration and digestibility. This is definitely not true for ADF content of alfalfa shown in Figure 1. It clearly shows the relationship between ADF and NDF digestibility varies for pure alfalfa samples from the Worlds Forage Superbowl. RFV and RFQ are the same for alfalfa when fiber digestibility is average. They differ primarily as fiber digestibility varies from average.
We have used forage quality sticks for several years to estimate when to take first-cutting alfalfa based on RFV. Since RFQ is a better estimate of forage quality than RFV, we wondered if there was any thumb rule to compare Relative Forage Quality to Relative Feed Value?

During the springs of 2006, 2007, and 2009, we conducted a study to determine the rate of alfalfa forage quality change during spring growth. In particular, the interest was in the rate of digestible fiber change and the relationship of RFV to RFQ rates of change.
The study consisted of repeated samplings of alfalfa from multiple sites in Wisconsin and Minnesota. Sampling took place between May 15 and June 20.
The average rates of change of several forage quality components are presented in the table above. Generally, the rate of quality change was slightly less in 2006 than 2007 or 2009. It should also be noted that the rate of forage quality change in 2006 was higher within each location than the overall average indicates. So the actual rates of change within a location were more similar among years than the table indicates.
When we compared changes in RFV and RFQ during the 2009 spring greenup, we found a very highly correlated (average 0.97) linear relationship each year as shown in Figure 2. Also, as expected, the decline of RFQ change per day was greater than the decline of RFV per day. This is due to the fact that RFQ rate of change is composed of both the NDF rate of change (which is a responsible for the RFV rate of change) and the fiber digestibility (NDFD) rate of change. Overall relationship was very consistent with RFQ change averaging 1.3 times RFV.
Generally, digestible fiber of alfalfa is higher than average on first cutting but it declines at a linear rate as fiber is building. The major difference among years is the bias (how much higher than average digestible fiber is). Thus, we can convert RFV (from forage quality sticks) to RFQ by determining digestible fiber (and RFQ) on one sample in the early spring and calculating the bias used to adjust all other RFV readings.
To calculate bias from sample analysis results use the formula:
Bias = RFQ – (1.3*RFV)
Then, to convert RFV readings (for example, from a forage quality stick) to RFQ, multiply RFV by 1.3 and add bias according to the following:
RFQ = (RFV * 1.3) + Bias

100425_297


