With Class I milk sales garnering the best return to dairy farm milk checks, Northeast dairy farmers have long benefited from higher Class I milk sales than most other regions of the country.
That is no longer the case . . . as Class I volume has dropped 11.3 percent from 2012 to 2017. The total share now stands at 30.7 percent compared to 42 percent just five years earlier.
What caused this situation?
The answer is twofold and involves both supply and demand. While we all know that beverage milk sales have been sputtering, more milk on the market also means that other products have contributed greater proportions to producer milk checks.
In the Intel “Three states accounted for 44 percent growth,” we noted that New York added 2 billion pounds more milk to the dairy pipeline since 2010. That new milk contributed to the lion’s share of the reduced portion of Class I milk sales in dairy farm checks. To put this new milk into greater perspective, for 19 straight months the Northeast Federal Milk Marketing Order posted record-setting milk volumes.
What areas went up?
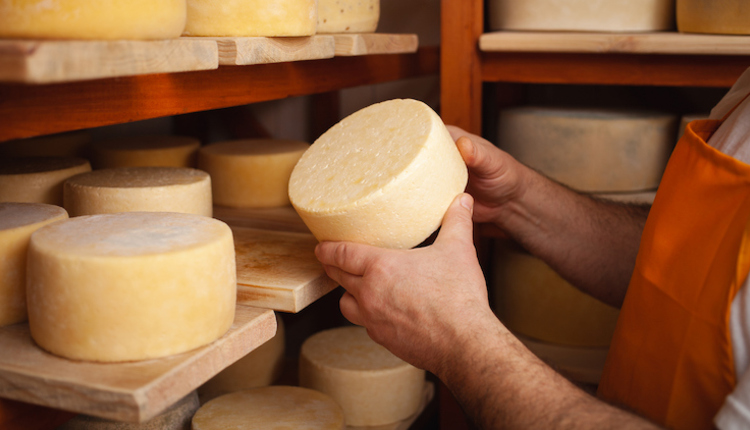
Class III absorbed the most milk as utilization rose 21.8 percent, reported the Northeast Federal Milk Marketing Order administrator. That Class III milk goes toward cheese production.
The much talked about yogurt market detailed in Class II sales has moderated to some degree after extreme growth between 2010 to 2012. Even so, that part of the paycheck grew 5.9 percent.
(c) Hoard's Dairyman Intel 2017


