Lying time and activity have gained popularity in the industry as measures of health and welfare. It was this knowledge that drove European researchers to graph the lying time as a function of days in milk.
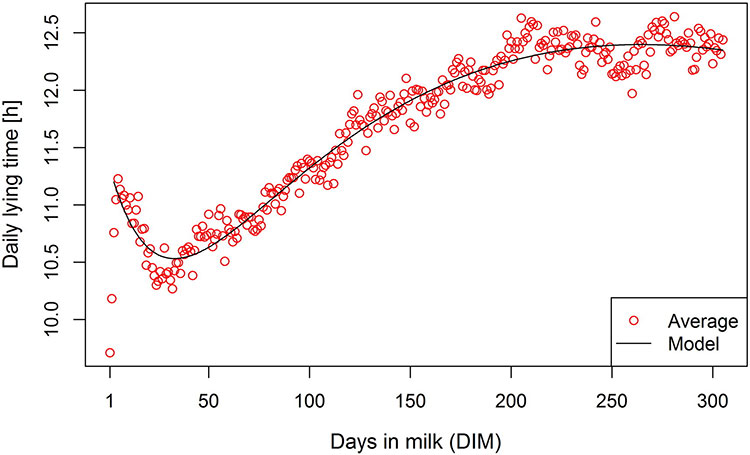
The lying time curve was adapted from the traditional lactation curve to show the regular change in lying time behavior based on stage of lactation. Data used to compile the graph came from four Danish dairies and 53,653 days of data collection from 366 cows milked twice per day.
Cows spent the shortest amount of time lying during the period following calving with this research finding the least amount of lying time occurred at 33 days in milk with 10.5 hours per day. Conversely, the greatest amount of lying time was recorded at 265 days in milk when the studied cows spent 12.4 hours per day.
Researchers predicted that the change in lying time was mostly compensated by a change in standing time rather than walking time. They suggested eating time requirements for high production and discomfort for milk carried in the udder were factors leading to the low resting time during early lactation.
Researchers also charted step frequency and motion index (leg activity) finding that both measures held similar curves to lying time with steps and motion being lowest in the time following calving.
As described by this model, the lying time, step frequency, and motion index curves are near inverses to the lactation curve. For the transitioning cow, this could have repercussions in health, welfare, and even production.
(c) Hoard's Dairyman Intel 2017
August 21, 2017


