When consumers spent $1 on dairy products in 2017, dairy farmers received 30 cents of that dollar. That’s according to the latest research by USDA’s Economic Research Service.
Since 2000, the number climbed to as high as 38 cents from every $1 in consumer spending during 2014 when farm-gate milk prices reached record highs. The number dropped to a low of 24 cents in 2009 when dairy margins hit rock bottom and milk checks fell to a modern-day low.
What happened to the remainder of the money consumers spent on dairy products in 2017?
It went toward processing, transportation, retailers, and other venders in the supply chain.
Not all dairy products are equal, as some products return more or less to those producing milk on the farm.
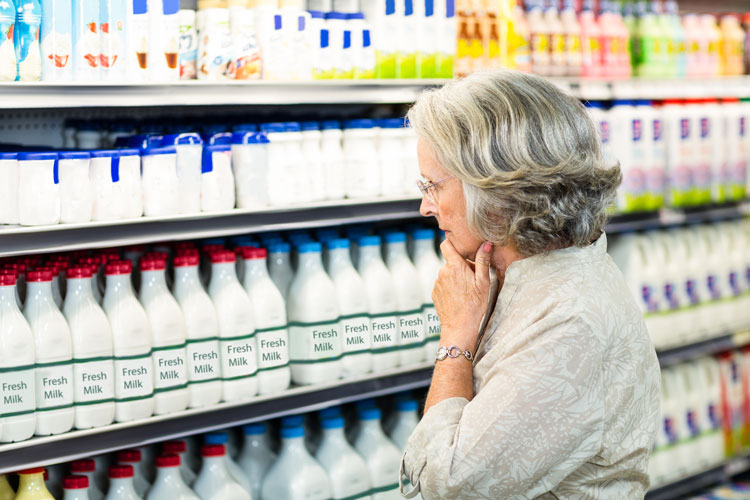
Whole milk: Fluid milk represents the high end of returns for dairy farmers who received 51 cents every time a consumer spent $1 on fluid milk. Just like all dairy product sales, the previous high this century occurred in 2014 when dairy farmers received 61 cents. The low point in the spectrum occurred in 2009 at 40 cents.
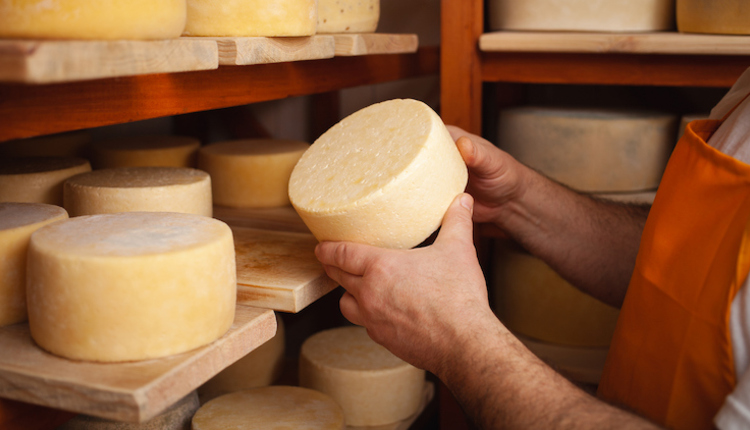
Cheese: This product tends to mirror the larger dairy basket as a whole. This year it outshined the combined dairy category by 2 cents by returning 32 cents to dairy farmers for every $1 spent. Since 2000, the cheese category ranged from 24 to 39 cents for every $1. As one would expect, 2009 was the low. Alternatively, 2007 was the high at 39 cents.
Ice Cream: This is the lowest return product with only 19 cents from every $1 in sales going to dairy producers last year. The lower farm share of ice cream is linked to the additional nondairy ingredients and further processing of the product. Like all other dairy product categories, 2009 also was the low point for ice cream at 12 cents with a range of 12 to 22 cents per dollar since 2000.
Overall, dairy farmers’ share of the retail food dollar tends to track higher during high milk prices. Of course, 2014 represented one of the best milk price years in modern dairy history.
To review the actual data sets, click this link.


