WORLD PRICES AND CYCLES
Prevailing milk prices in the development of the world and the U.S. are shown in the figures. In Figure 1, the IFCN World Milk Price is based on the weighted average of three IFCN World Price Indicators: skim milk powder and butter (35 percent), cheese and whey (45 percent), and whole milk powder (20 percent). This converts the global dairy commodity prices into a global “farm-gate milk price indicator.”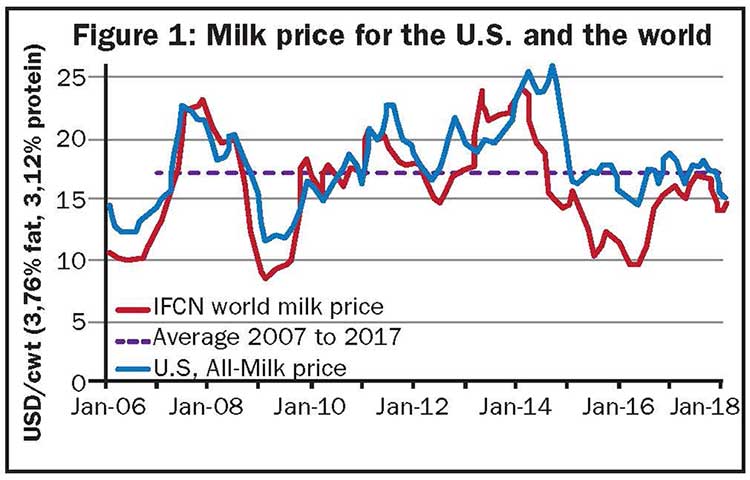
Since 2007, the world milk price has ranged from lows of $8.40 per hundredweight or cwt. (milk with 3.76 percent fat, and 3.12 percent protein) to over $24 per cwt. on the world level. On average, this price was $17.20 per cwt. from 2007 to 2017. For the sake of discussion, all prices are based on the U.S. dollar. The last 11 years can be divided into five phases:
Phase 1 (duration: three years, 2007 through 2009): This was the first roller coaster scenario with a low milk price of $8.40 and price peaks of $23.30 per cwt. on the world level. The price fluctuation was almost plus or minus 50 percent around the mean or average. The start of this cycle was driven by global demand that was growing faster than worldwide supply in 2005 and 2006.
Phase 2 (duration: one year, 2010): In this period, world milk price was quite stable with a fluctuation of only plus or minus 10 percent. This level of stability was driven by the high level of stocks at the end of 2009. That gave the market a certain floor until inventories were gone.
Phase 3 (duration: two years, 2011 to 2012): In this period, world milk price showed a moderate volatility of plus or minus 20 percent. In this time, world milk supply and demand had been growing at a similar rate and a minor imbalance existed.
Phase 4 (duration: four years, 2013 to 2016): A new roller coaster scenario started with high world milk prices in 2013 and 2014 and low prices in 2015 and 2016. This fluctuation at plus or minus 50 percent mirrored Phase 1. The key driver that triggered this phase was the low milk supply in 2013.
Phase 5 (duration: one year, 2017): A phase of relatively stable milk prices of $15.80 per cwt. in February 2017 and a fluctuation of only plus or minus 10 percent. This phase is quite comparable to the Phase 2.
Phase 6: In 2018 a new price cycle will start. How this cycle will develop depends heavily on the milk supply growth in 2018. IFCN real-time estimates for milk markets in 62 countries indicate that milk supply grew at a rate of over 3 percent this February. That is significantly higher than the normal demand growth.
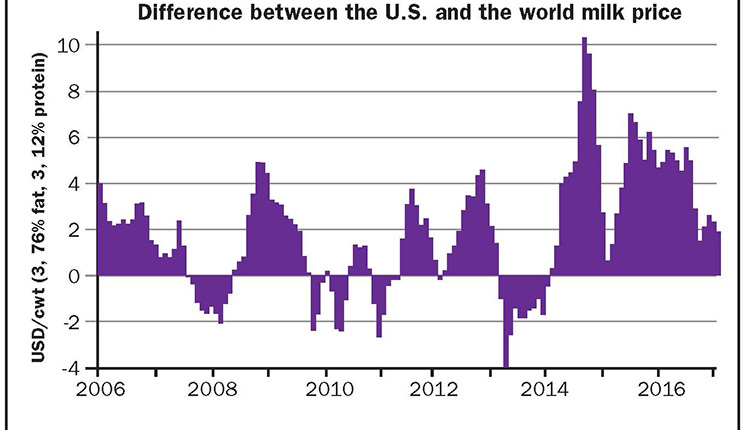
THE WORLD COMPARED TO THE U.S.

In general, as shown by the red line in Figure 1, the world market price for milk has been a key driver for the U.S. farm-gate milk price. Three different phases can be observed here:
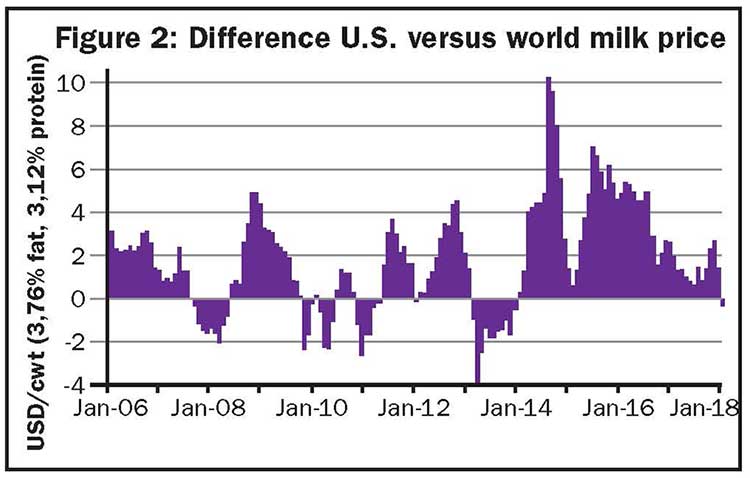
Phase 1 (2007 to March 2014): In this time, there was only a minor difference between the world market price and the U.S. milk price.
Phase 2 (April 2014 to August 2016): The U.S. milk price was, on average, 30 percent higher than the world milk price. This was driven by the much higher butter prices in the U.S. versus the rest of the world. This was a result of:
- The rapid growth in demand for butterfat in the U.S.
- The fact that cheaper butter from the world market could not enter the U.S. market.
In this phase, the U.S. became less reliant on world milk prices and did not suffer from the price lows like dairy farmers in the EU, Oceania, or South America.
Phase 3 (September 2016 up to now): The U.S. and the world price are much closer aligned. This has happened for two reasons:
- The milk price has well-recovered on a level of $15.50 per cwt.
- The slow down of demand growth for butterfat and, related to this, the alignment of U.S. and world butter prices.
U.S. dairy farmers have benefitted from the strong demand growth for butterfat in 2014. As a result, 2015 and early 2016 milk prices were 30 percent higher than those found in the rest of the world. In the future, this will not be the case and the U.S. will most likely follow world milk prices. This also means America will have higher milk price volatility than in the past.
A new milk price cycle will start this year. IFCN tracks milk supply in over 60 countries. Our analysis indicates that milk supply is growing faster than milk demand. Therefore, the new price cycle most likely will start with a price downturn.
WHAT IS IFCN?
IFCN started in 2000 as the International Farm Comparison Network, uniting research partners via the in-depth analysis of the typical dairy farming systems around the world. Since then, the research network has extended its analysis towards all aspects of dairy economics and sustainability topics. Via this cooperation, IFCN creates a better understanding of a complex and fast changing dairy world.
The network relies on the main pillars of the IFCN Research Partners, IFCN Supporting Partners, and the IFCN Dairy Research Center managing the network, data, and knowledge from Kiel, Germany. Currently, researchers from over 100 countries and of about 120 dairy related companies are members of the network. The annual results are published in the IFCN Dairy Report. For more details, visit www.ifcndairy.org.
Read Other Recent Milk Check Outlook articles