The author is an assistant professor of applied economics at the University of Minnesota.
As the U.S. dairy sector completes the fourth consecutive year of low or negative farm income, dairy farm numbers are witness to the dire effects of the harsh economic conditions. In early October, the number of licensed dairies in Wisconsin stood at 8,304, or 634 dairies less than at the same time last year. The 7 percent exit rate is the highest observed since 2001. In Minnesota, the exit rate is even higher, at 7.8 percent versus a year ago.
What does the future hold?
Let’s discuss five factors that will drive the consolidation rates in the next three years.
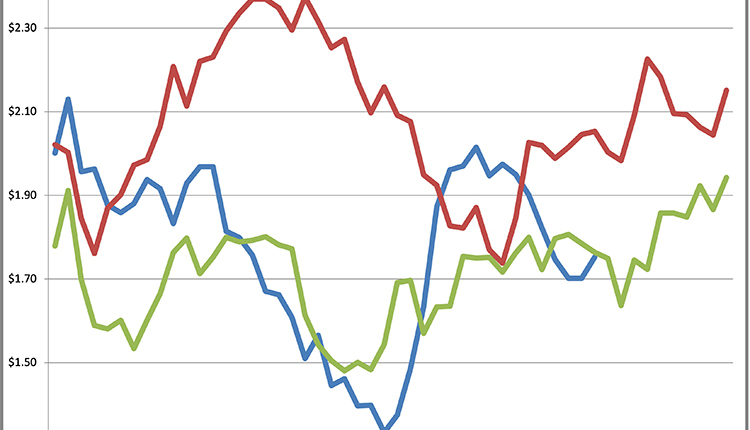
- Exports. Our analysis must start with exports. During the 2007 to 2014 period, U.S. exported 79 percent of all incremental skim solids pounds. Over the last 36 months (through August 2018), only 33 percent of incremental skim solids found a home abroad.
U.S. exports are exhibiting decent growth in 2018, but sustained growth will be needed to prevent oversupply of domestic markets. In the first half of 2018, the U.S. was exhibiting strong growth in dairy exports to Mexico and Southeast Asia.
Most recent trade statistics also reveal the deleterious effects of trade wars on cheese exports to Mexico and overall dairy trade with China. To relieve pressure from farm profit margins, U.S. dairy exports will have to grow strong enough to be able to absorb 40 to 50 percent of all growth in skim solids produced in 2019. - Farm bill. The next farm bill is likely to slow U.S. dairy consolidation trends, but it will not completely arrest the acceleration in exit rates. The most recent publicly available version of the proposed legislative language calls for rebranding Margin Protection Program for Dairy (MPP-Dairy) as the Dairy Risk Coverage program (DRC) and raising the maximum coverage level from $8 to $9 per hundredweight (cwt.).
With the new DRC program, participating dairies would see their revenue climb by 75 cents to $1.25 per cwt. on average for production covered at $9 per cwt. at tier 1 premiums. However, even with this increase, net income will not return to levels experienced over the 2007 to 2014 period.
Using the data from Farm Credit East’s Northeast Dairy Farm Summary, we find that the net family income was $2.26 from 2007 to 2014. Over the 2015 to 2017 period, even if DRC was in effect and used at the most highly subsidized $9 per cwt. coverage level, net family income, including DRC net benefits, would still be only 78 cents per cwt.
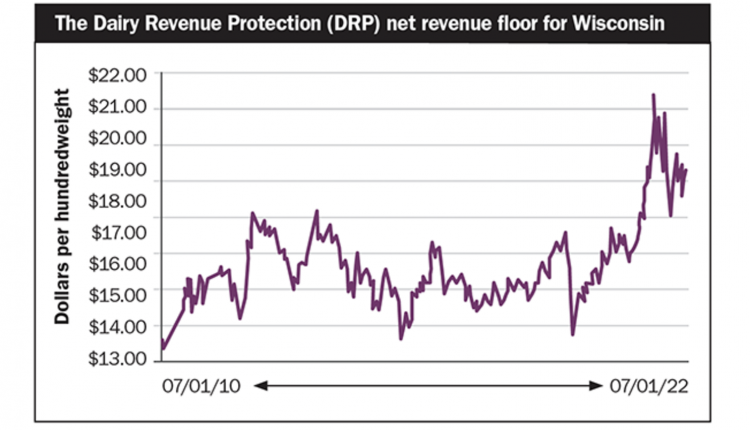
The University of Minnesota’s FINBIN data maintained by the Center for Farm Financial Management saw average net farm income of $1.13 per cwt. from 2007 to 2014. It would have been 80 cents per cwt. if DRC was in place over 2015 to 2017. - New coverage. Dairy Revenue Protection (DRP), a new USDA crop insurance program for dairy producers, may offer new options. DRP covers risk to milk price revenue (milk price and state-level yield per cow risk). While premiums are subsidized at 44 to 59 percent, the subsidy rarely exceeds 20 cents per cwt.
DRP may eliminate sharp “mortal wounds” that short-lived price slumps can cause to producers who already have a fragile liquidity and solvency situation. To protect against prolonged price depressions, producers would be advised to use distant quarters offered on sale.
Furthermore, unlike the farm bill program or Livestock Gross Margin- Dairy (LGM-Dairy), DRP does not impose upper limits on the farm production. That could reduce the exit rates among financially strained large dairy farms. All things considered, the effect of DRP on national dairy consolidation rates will depend on the adoption rates among medium- and large-size dairy farms. - Premiums. The fourth relevant factor is reduced or negative milk price premiums. In areas where production growth strained processing capacity, relief will come from in the next 12 to 36 months through plant expansions or greenfield investments.
The block-barrel cheese price spread will likely normalize as cheddar plants improve the flexibility of their product mix. However, unless the additional dairy product output can find a home abroad, positive impact of increased local basis may be offset by lower national milk prices. - More expansion. Consolidation in dairy farm numbers is to a large extent due to growth in average farm size and the proportion of dairy herds with over 2,000 cows.
At the University of Minnesota, we have recently started developing methodology for tracking and aggregating permit data for new and expanding Confined Animal Feeding Operations (CAFOs) from major U.S. milk-producing states. Our early experimental reports can be found at https://dairymarkets.org/. We find that current low prices have not eliminated the incentives to build new dairy operations. South Dakota and Texas may lead the growth in 2019.
Some analysts have remarked that dairy is entering a phase similar to what the swine sector went through in the second half of the 1990s. Between 1994 and 2000, the number of U.S. hog operations declined from 207,980 to 86,360, or 13.5 percent per year. The most dramatic decline occurred in 1997, when 21.8 percent of hog operations left the industry.Exit rates in the U.S. dairy sector since 1965 were never so high. In the late 1960s and early 1970s, dairy exit rates were just over 10 percent. During the dairy policy adjustment period in the second half of 1980s, they peaked at 8.5 percent. Ever since, they have fluctuated between 4 and 6 percent per year, with only a few years outside that range.
Since 2010, the exit rates were below 4 percent per year. Considering current consolidation drivers against historical trends suggests we should expect the national dairy exit rate to be higher than in the first part of this decade, but it will likely not exceed 8 percent per year over the next three years.