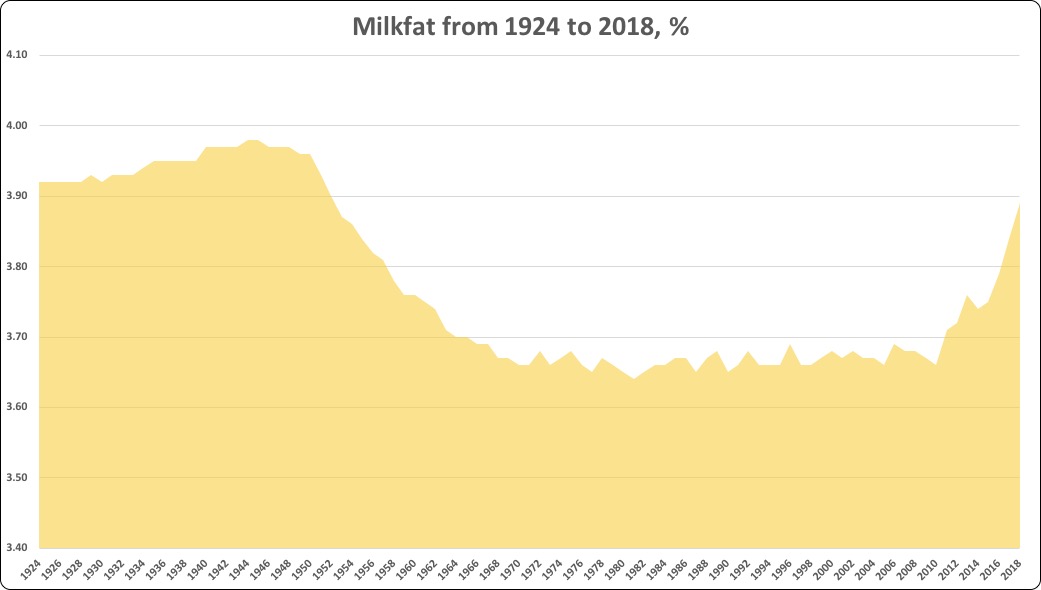
For back-to-back years, butterfat levels in the collective U.S. bulk tank posted 0.05 percentage growth. Those year-over-year gains were the largest since USDA began tracking the statistic in 1924. Given this new information, U.S. butterfat levels now nearly match those from 1952 when the national bulk tank averaged 3.90 percent butterfat.
Here are the exact details:
2018 — 3.89 percent butterfat from the 217.6 billion pounds of milk flowing from U.S. dairy farms.
2017 — 3.84 percent butterfat from the 215.5 billion pounds of U.S. milk production.
2016 — 3.79 percent butterfat from the 212.4 billion pounds of U.S. milk production.
A seismic shift
This is a tremendous swing of the pendulum. From 1966 to 2010, milkfat fluctuated a mere 0.05 percentage points — from 3.64 to 3.69 percent. Since the start of this decade, milkfat swiftly climbed from 2010’s 3.66 percent to 3.75 percent in 2015. That was followed by even steeper climbs, from 2016’s 3.75 percent to the new mark of 3.89 percent this past year.
Not a record
As eluded to earlier, USDA began tracking milkfat data in 1924. Beginning at that moment in time, milkfat ranged from 3.92 to 3.98 percent from 1924 through 1951. From 1953 to 1966, butterfat descended from 3.87 percent to 3.69 percent. Then percentages hovered between 3.64 to 3.69 percent for 44 straight years.
Product driven
With consumers once again embracing full-fat products, we expect that dairy farmers will continue to shift strategies to produce even more milkfat. The new consumer trends go far beyond butter and include growth in whole milk and full-fat cheeses.


