Forage polls conducted across the country provide a peek into this year’s feed outlook. The polls involve gathering data from a forage testing laboratory database and charting the results over time to grasp impactful trends. This task is common around this time of year, when new hay and haylage crops are going into silos, bags, bunkers, piles, and pits.
As the forage polls are coming in, we’re seeing some intriguing results. The following figures give us an idea of how the hay and haylage quality is shaping out from East to West Coast this year with a crop or two in the books.
Western hay quality
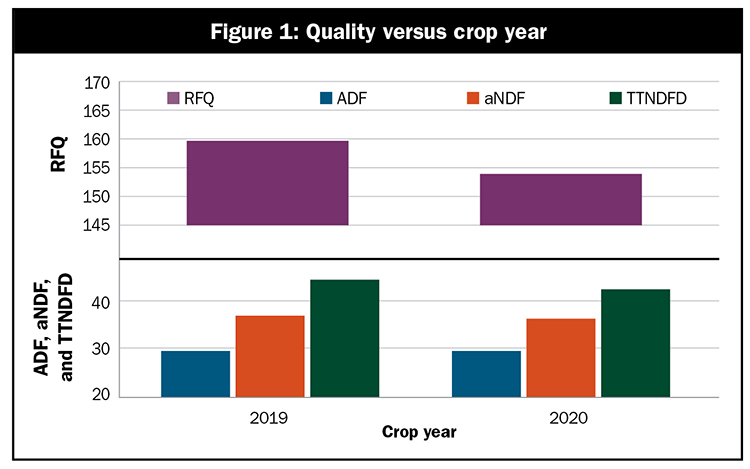
The forage quality poll looking at fiber and fiber digestibility (Figure 1) suggests that the 2020 hay crop is equivalent in fiber to many years but is less digestible. The reasons behind this are likely driven by environment characteristics and harvest timing. Working with a few Western consultants has confirmed that. One recently suggested there could be more spread in hay qualities this year due to rains interfering with cutting schedules.
Midwestern and Eastern haylage quality
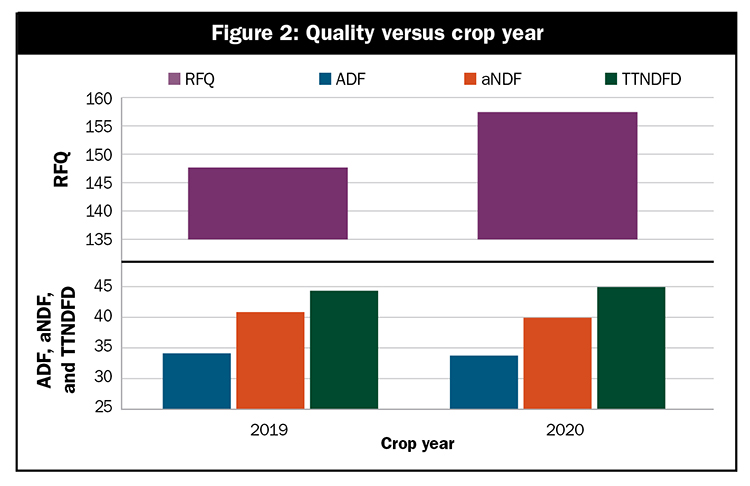
In the Midwest and East, many harvested a week or more later than historic cut dates; however, the spring was cool and slower growing, and the crop quality looks strong. Following much lower protein crops in 2019, protein levels have rebounded in 2020 (data not shown). Midwestern haylage fiber levels are down and fiber digestibility is up (Figure 2), equating to substantially more energy per ton in 2020.
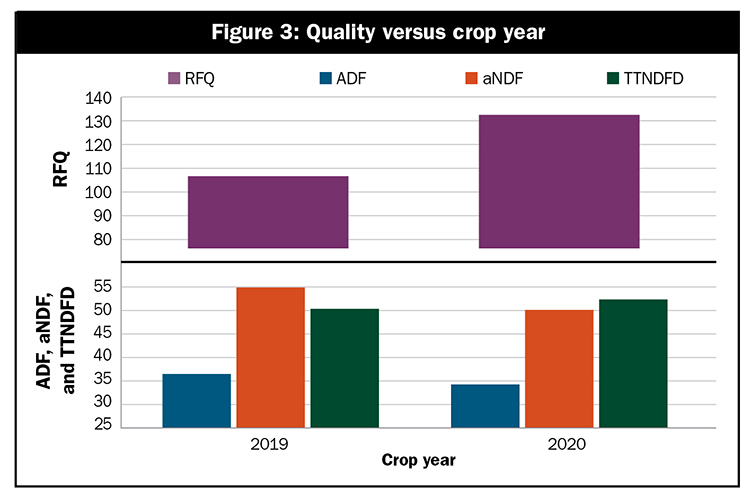
Eastern U.S. haylages even exceed the quality results of the Midwest. Adding to the exceptional quality poll trend, small grain and grass silages in the Eastern region appear to be rocket fuel quality despite lower protein levels (data not shown). The appropriate animal nutritional definition for “rocket fuel” is low fiber and exceptionally high fiber digestibility (Figure 3). University of Wisconsin’s Dave Combs’ total tract neutral detergent fiber digestibility (TTNDFD) measure on these forages shows a 10- to 15-unit improvement year over year, which could easily be attributed to a couple pounds of milk per cow per day for dairies with a substantial haylage amount in the diet.
Use these crop quality polls as a directional indication of the impact that the growing environment and conditions are having. Take these observations further by comparing and contrasting your crop results with the general observations here. Have your nutritionist, harvest team, and agronomist at the table with you for the greatest benefit.


