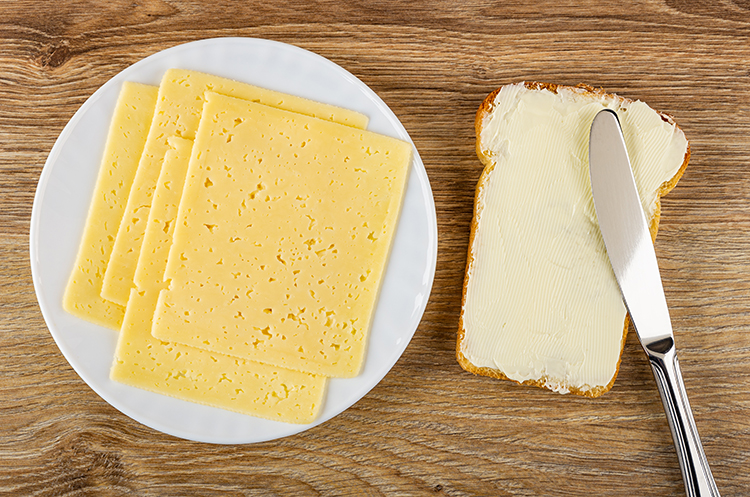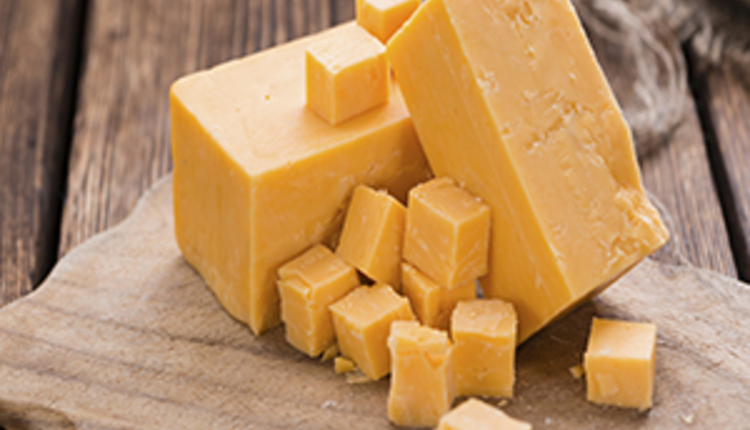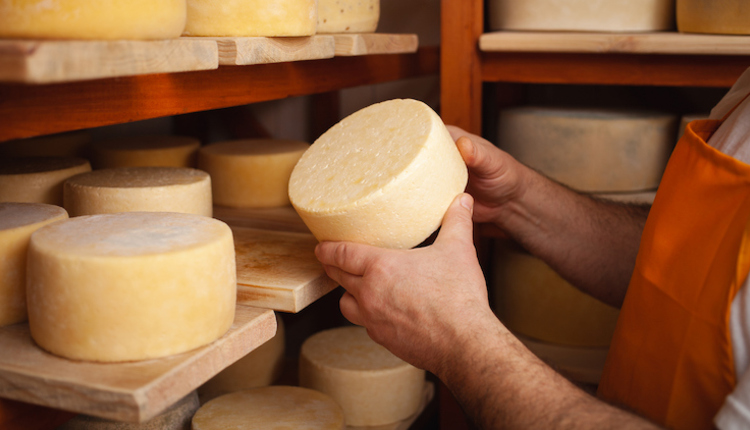
Even though the percentage of dairy fat going into the cheese vat slipped to the lowest share since 2014, cheese is the clear leader when it comes absorbing dairy fat among dairy products. In 2020, cheese accounted for 41.7% of all dairy fat use.
That’s according to data from USDA’s Economic Research Service. When combined with butter, dairy’s dynamic duo turned 61.2% of dairy fat in into nutritious dairy products for consumers.
Going back to cheese, the total category peaked at 42.8% in 2018 when looking at data from 2000 to 2020. As recent as the turn of the century, cheese accounted for 38% of all dairy fats.
Percentages are one matter . . . then there are total pounds. Just this past year, 3.7 billion pounds of dairy fat went into cheese vats compared to 2.3 billion pounds in 2000. Of course, that means total fat production across the country has exploded in the past two decades growing from 6.2 billion pounds to 8.9 billion pounds.
Butter stands second to cheese. Just this past year, butter consumed 19.5% of total dairy fat production. That’s the highest level since the 19.8% figure posted in 2013. Just one year prior, 2014’s 20% topped the charts over the past two decades. This compares to a 16.3% share for butter in 2000. Just like cheese, butter’s total pounds climbed over the past 20 years from 1 billion pounds in 2000 to 1.7 billion pounds in 2020.
One category that has clearly lost market share is fluid milk. Just this past year, beverage milk accounted for 11.2% of total dairy fat production. That metric is the lowest total over the past 20 years, with the drinkable category accounting for 18% in 2000. As one would suspect, total pounds of dairy fat needed to fill containers slipped from 1.1 billion pounds in 2000 to 995 million pounds in 2020.
Rounding out the major dairy products, frozen dairy products accounted for 7.5% of dairy fats while sour cream took 3.2%
To download the entire dataset, go to the ERS Dairy Data portal and click on “Supply and allocation of milk fat and skim solids by product.”


