Federal Milk Marketing Orders (FMMOs) have come under scrutiny over the last few years. Many folks are critics of the current program, which implements minimum prices for regulated milk from coast to coast. There are a few areas, like western New York or central Pennsylvania, and whole states like Montana that are regulated by state orders with policies similar to their federal counterpart. California was the largest state order . . . until producers in that state voted to become a federal order in 2018.
That potentially brought quite a bit more milk into the federal order system. However, under a FMMO, only Class I fluid plants must be regulated. Manufacturing plants may be regulated if they choose to be.
From day one of that new California order, there has been quite a bit of unregulated milk in the state. Because Class I differentials are relatively small, and fluid utilization is also low, there simply isn’t enough money generated to keep all of the plants in the pool in every month. Some months it is advantageous for cheese plants to depool, and some months butter-powder plants may choose to exit.
Moving beyond California
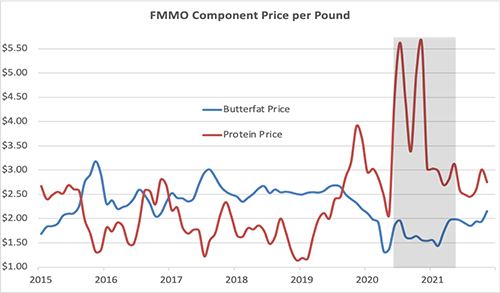
Under extreme conditions, the same thing can happen in most federal orders. From June 2020 through May 2021, there were very large negative producer price differentials (PPDs) in many orders, which signaled to cheese plants that they might not want to pool their milk.
The negative PPDs were the product of unusual price relationships. Our product price formulas calculate a protein value from a weekly survey of cheese sales and a butterfat value from butter sales. The graph shows just how extreme the protein values were during that time compared to butterfat. There was a strong incentive for cheese plants to sit out for a few months.

The Agricultural Marketing Service of USDA, which oversees the federal orders, publishes an annual bulletin entitled “Measures of Growth in Federal Orders.” This document tracks the number of federal orders since 1947 and it also shows the number of producers in those orders, the amount of milk sold (receipts), and the amount used as Class I.
It is telling when looking at this bulletin just how much milk was depooled in 2020. Of course, we never know exactly how much avoided the FMMOs because of the class price relationship to the uniform price, but the data do show that only about half, or less than half, of producer milk was regulated in the states of California, Wisconsin, Idaho, Texas, Minnesota, New Mexico, and Washington.
The 75-year shift on fluid milk
Using NASS milk production and data from "Measures of Growth in Federal Orders," we can see that fluid utilization has gone from about two-thirds of the milk volume in 1947 to less than one-third today. And, Class I differentials sitting on top of an $18 basic formula price generates much less money to keep manufacturing milk in the pool today than when federal orders were first implemented.
Negative PPDs can be annoying on a milk check and difficult to explain in simple terms. But they are really a symptom of structural issues in federal orders rather than the problem itself. Federal orders were built around fluid milk, and we are living in a manufacturing world.


