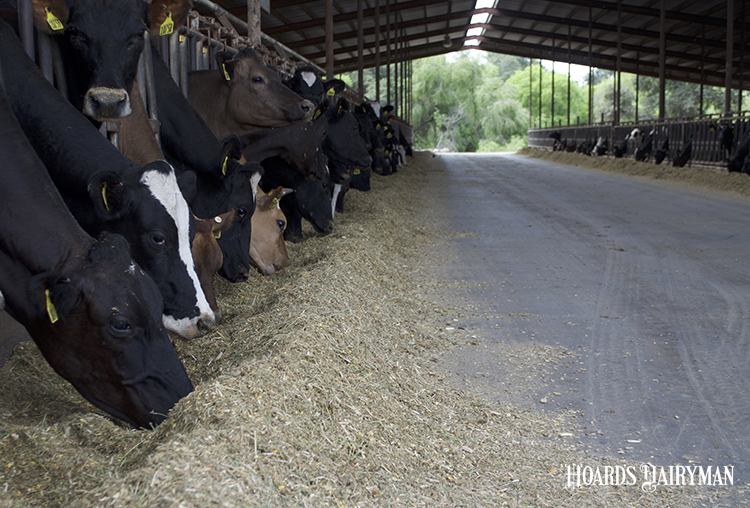
While cow numbers in the nation’s dairy herd held steady, dairy farm numbers did not follow the same course. In losing 5.7% of the farms holding a permit to sell milk, dairy farm numbers fell to under the 30,000 threshold for the first time since America’s pioneer days. At the midpoint of 2021, the U.S. had 29,858 dairy herds holding commercial permits to sell milk.
In 1992, Hoard’s Dairyman partnered with the American Farm Bureau Federation to begin tracking commercial dairy farm numbers by obtaining milk permit data from each state. These days, USDA’s National Agricultural Statistics Service (NASS) tabulates the information and publishes the metric in the February edition of USDA’s Milk Production report.
A 30-year snapshot
Since 1992, the drop in licensed or so-called commercial dairy farms with permits to sell milk to processing plants has declined from 131,509 to 29,858. That’s a 77% drop during that time, with 101,000 fewer farms but nearly the same number of cows.
In 1992, the nation had 9.7 million dairy cows. Fast-forward to the present and there are 9.4 million dairy cows in the national dairy herd. That combination of fewer farms and steady cow numbers has caused the average herd size to climb to 317 head. This is the first time the nation’s dairy herd pushed past the 300-cow mark as average herd size grew by 20 head from the prior year’s 297 cows.
In the past 30 years, average herd size has grown by 330% from 74 to 317 cows. Regionally, the West (+437%) and the Midwest (+340%) have seen the largest percentage gains in herd size. The West grew from 263 cows in 1992 to 1,413 cows in 2021, while the Midwest shifted from 51 to 225 cows per herd in the past 30 years.
A look at the major dairy states
Of the dairy states with over 1,000 dairy farms, Ohio was hit especially hard, losing 7.2% of its operations, while New York lost 6%. On the flip side, all other states with over 1,000 dairy herds were under last year’s national average of 5.7%. California paced this group, with only 1.6% herds calling it quits. Pennsylvania and Wisconsin were the next most resilient group, down 4.2% and 4.8%, respectively.
These farm numbers are a snapshot in time. For example, in February 2022, Wisconsin had 6,483 dairy farms. The data for USDA’s report was collected in late June 2021, recording 6,770 farms with permits to sell milk in Wisconsin. That means the exodus in America’s Dairyland has slowed even further by recording a 4% departure rate compared to the 4.8% in the 2021 data set and the 7.9% in 2020.
For a deeper analysis, complete with tables for each state, turn to page 148 in the March 2022 edition of Hoard’s Dairyman.


