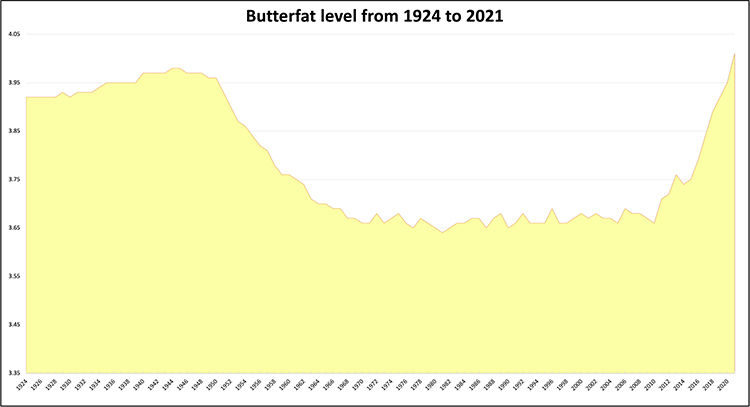
It’s official — the 4.01% butterfat level posted in 2021 broke the previous 3.98% butterfat record set both in 1944 and 1945. This market data comes from the United States Department of Agriculture (USDA), and it’s the most accurate measure for butterfat levels for the milk produced throughout the United States.
As shown in the graph, butterfat levels have shifted sharply in recent years, moving from 3.79% in 2016 to 4.01% in 2021. These days, full-fat dairy products are the leading category when it comes to the dairy case and restaurant tables. As a result, butterfat is as valuable as it’s been for decades. That hasn’t been the case for several generations.

Butterfat had been lagging in value for a number of decades. That’s because saturated fat was implicated in heart disease, and suddenly butter and higher fat products fell out of favor. As a result, butterfat content in milk from the nation’s dairy farms hovered in a tight window of 3.66% to 3.69% from 1966 to 2010 — a 44-year stretch.
Prior to that time, butterfat levels were in vogue. From 1924 to 1950, the nation’s milk supply ranged in another tight window of 3.92% to 3.98%. Indeed, what is old is new again when it comes to the butterfat market trends. That’s because Dr. Ancel Keys and his diet-heart hypothesis has been debunked.
The modern-era butterfat data comes from USDA’s National Agricultural Statistics Service (NASS), and it can be found in its “Quick Stats” dataset. To locate the historic data tracing back to 1924, one must turn to Dairy Statistics through 1960 published by USDA’s Economic Research Service (ERS). That book is a treasure trove of historic dairy market trends, and the Hoard’s Dairyman editorial team frequently references its 1960 edition.


