Eat butter. That declaration appeared on the cover of the June 23, 2014, edition of Time magazine. By the time that bold statement appeared, the “Fat is back” revolution was well underway. Even so, it was impressive to read the “mea culpa” declaration, along with the secondary headline on that same cover, “Scientists labeled fat the enemy. Why they were wrong.”
Just 30 years earlier, that same international magazine featured an image with a bacon-and-eggs frowny face. On the cover, Time declared, “Cholesterol, and now the bad news . . .” as it doubled down on a fat and cholesterol is bad narrative when it came to heart health in the human diet.
While these events were unfolding, the dairy industry was quietly undergoing a metamorphosis. In 1978, milk protein tests began being calculated by the Dairy Herd Improvement Association (DHIA). Soon after, USDA began developing sire evaluations for protein, and the first ranking for the new production trait appeared in the 1983 Hoard’s Dairyman Bull List. As these developments took place, Mozzarella production began to break out as the country’s second-leading cheese variety. By 2010, Mozzarella surpassed the longtime leader, Cheddar. As a low-fat cheese designed for pizzas, Mozzarella production efficiency is enhanced with high protein milk.
Milk’s transformation
Right about the time A.I. sires began being ranked by protein, Utah State researchers developed a new cheese yield pricing formula that recognized and focused attention on the critical and usually limiting protein component. The so-called Van Slyke formula made it easier to develop a milk pricing formula that rewarded both milkfat and protein, in contrast to the super majority of milk pricing schemes of the day that didn’t encourage the production of high solids milk. The formula conceived in 1982 recognized what many cheesemakers had long known — higher solids yields more cheese.
Milk buyers were slow to adopt the concept. Convinced that their milk buyers were not sufficiently rewarding them for their high solids milk, 12 dairymen got together two years later and founded Hilmar Cheese. That Utah State cheese yield formula was a major portion of the business plan.
This new concept eventually became known as multiple component pricing (MCP). Although used sporadically by individual cheese companies prior to that point, the Great Basin Federal Milk Marketing Order (FMMO), centered in Utah, was the first FMMO to implement the idea on April 1, 1988. The milk component revolution was now underway, and it’s been permeating the dairy industry ever since.
Fast-forward to 2021, and over 92% of the nation’s milk supply is priced using MCP formulas. Three federal orders in the southeastern U.S. and the Arizona order are the lone holdouts largely due to the major share of their milk being marketed in the fluid milk category and low levels of Class III cheese.
What’s going in the tank?
Over the past decade, a better indicator of gains in dairy farm output has been milk solids production versus the time-honored milk production itself. That latter metric is still the hallmark for USDA reports.
Let’s face the economic facts — water hinders our milk marketing efforts these days. That liquid freeloader, and its contributing weight, makes milk mighty expensive to haul. To balance today’s market needs, some veteran analysts have predicted a 4.2% butterfat and a 3.2% protein would be the ideal blend in the national bulk tank. This, of course, is a projection, as no one can definitively pinpoint the perfect milk composition.
Is that an outlandish goal? Could U.S. dairy farmers even reach that lofty target?
Consumers in this nation and around the world buy dairy products, not milk from the cow. Every dairy product, even fluid milk in most cases, has a different combination of milkfat and skim solids. Prices send the signal to make more fat relative to protein, or vice versa. Farmers can’t turn that on and off like a light switch, but for the last decade the price signal has been to produce more milkfat.
In this sense, the U.S. is a fat-deficit nation. U.S. dairy exports have grown to equal about 17% of the nation’s milk solids production. However, last year we needed almost 23% of the milk marketed to provide the skim solids we exported but only about 5% was used to provide the milkfat exported. We have exports in the form of milkfat-based products such as butter and cheese but the fact is we have a big domestic market for those products.
In reviewing historic USDA data, butterfat levels held in a tight window of 3.65% to 3.69% from 1966 to 2010. A breakout took place as butterfat moved to 3.71% in 2011, busted out to 3.84% in 2017, and forged ahead to 3.92% in 2019. Last year, butterfat reached 4.01% and pushed past the previous historic high of 3.98% last recorded in 1944 and 1945.
Those later numbers make a great deal of sense if one reflects upon the economic incentives found in milk checks during that time. In 2016, milkfat began a 48-month run where it outpaced protein prices in all MCP-priced markets.
Meeting market demand
There’s long been a debate among dairy farmers: Breed for percentages or breed for pounds? When it comes to the bottom line, pounds are all that matter. That’s the pay-price metric in milk checks . . . pounds of fat or pounds of protein multiplied by the pay price. This is one of the reasons Holstein breeders have leaned toward improving milk density and the same reason why Jersey breeders have focused on improving pounds.
When looking at U.S. milk production from 2010 to 2021, total milk output climbed from 192.8 billion pounds to 226.3 billion pounds. That’s a growth rate of 17.3%.
Milkfat did far more.
From 2010 to 2021, total milkfat production moved from 7 billion pounds to 9.3 billion pounds. That’s an impressive 27.6% gain in butterfat. It stands to reason dairy market analysts should be tracking change in pounds of fat and protein, rather than total milk pounds, to fully understand the growth in shipments from the farm and what it means for our ability to turn that milk into dairy products.
Then there’s the fact that all of the base excess programs penalize shipping extra milk, or shall we say, shipping extra water. However, there is no specific disincentive for shipping more solids. And, hence, milkfat and protein shipments continue to outpace total milk production.
What’s happening to the dairy herd?
Without a doubt, feeding programs have played a major role when it comes to improving milk component production. However, the full impact is extremely difficult to quantify.
When it comes to genetic and breed factors, some like to point to the “browning” of the nation’s dairy herd, referring to the influx of Jersey genetics. While there isn’t a national dataset to fully indicate the breed makeup of the nation’s dairy herd, statistics from the National Association of Animal Breeders (NAAB), the trade association for artificial insemination companies, paint the best available picture.
In 2010, when the milk component boom began, 89.9% of U.S. semen sales were Holstein bulls and another 9% were Jersey sires. That yielded a 98.9% market share for the two major dairy breeds.
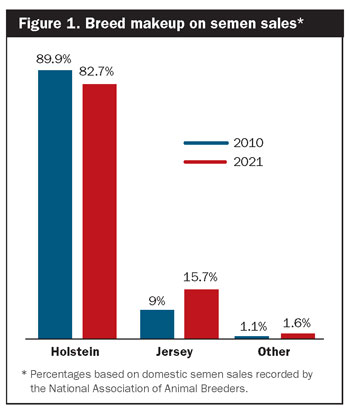
There’s another emerging trend as a small but growing category may be making an impact. It’s the “F-1.” Someday, it may be a new composite breed comprised of 50% Holstein and 50% Jersey genetics. Some A.I. studs are now selling semen from this breed, and one group shared that they are selling 5,000 units a month. At the moment, this F-1 breed remains a small player based on semen sales.
Getting back to the two major dairy breeds: Despite Jersey’s significant growth, Holsteins still represent at least four out of five cows in the U.S. dairy herd. Given that breed makeup, there is far more at play to move the national milkfat level from 3.66% to 3.98% in just 12 years.
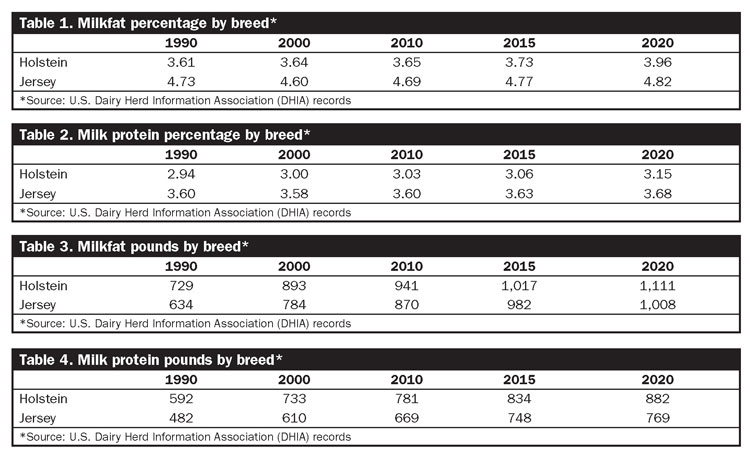
Data from DHIA documents the milkfat percentage change by breed in Table 1. From 2010 to 2020, all Holsteins on production test shifted from 3.65% to 3.96% milkfat. Jerseys also moved, but not by as much — 4.69% to 4.82%.
Table 2 documents the shift in protein. The Holstein breed moved from 3.03% to 3.12% during the same window. Jerseys grew by about the same percentage, moving from 3.6% to 3.68% protein. Most nutritionists will share that changing milkfat levels via ration formulation is a far easier endeavor than protein. If that scientific hypothesis holds true, there’s something else at play — genetics.
The genomics revolution
The wide-scale adoption of genomic testing on farms has accelerated genetic gains in the replacement herd. It only took 11 months for dairy farms to send in 1 million genomic tests from March 2021 to February 2022. That’s impressive growth given it took from 2008 to 2021 to record the first 5 million genomic tests.
The genomic test being sent in by farmers compares an animal’s DNA to the general population. With results in hand, the genomic test allows owners to know roughly 70% of a calf’s genetic potential right after birth. Also, given the 1 million tests metric, roughly one out of four dairy calves born last year had a genetic profile completed on them in a 12-month window.
Keep in mind that traditional breeding methods look at the characteristics of a dam and the sire’s history of passing along certain characteristics to his daughters. Using those methods, whether the heifer that is ultimately produced captures the best of its parents could not be accessed until that animal entered the milking string. Genomic testing, along with our knowledge of what genes are associated with what traits, allows us to look at a heifer calf’s genetic profile and know its potential two years earlier than in the past.
That’s just one way dairy farmers can improve an animal’s ability to produce higher component milk. However, there’s another accelerating factor. It involves the sire side of the equation. To be candid, genetic selection is moving at a breakneck pace.
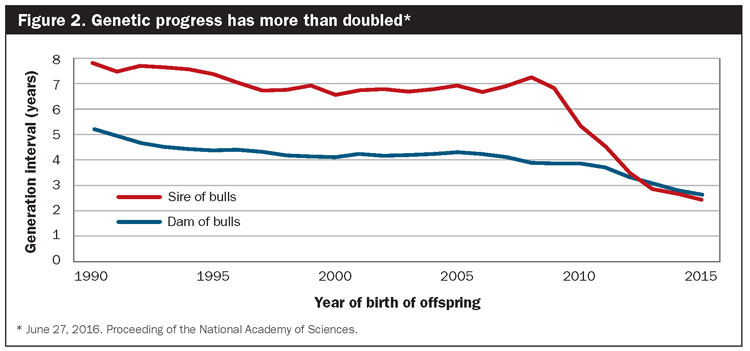
At the onset of genomic testing, the average age of the sire of a young bull was 6.8 years. Over the next five years, that number dropped to less than three years. That essentially doubled genetic progress by halving the generation interval, as shown in Figure 2. And this occurs because we no longer need a history of that sire’s daughters’ performance to measure his merit.
That’s just a portion of the story.
When genomic predictions came upon the scene, dams for the next generation of A.I. bulls averaged 4 years of age. In a 2016 study by USDA scientists, the number dropped to under 3 years of age. When this study gets updated, that number, both on the sire and dam side, could see another year shaved off the generation interval due to advanced reproductive techniques.
What this means for the bulk tank
Given the deep inroads that A.I. and genomics have made in our nation’s dairy herd, genetic progress may be taking place at a rate two to three times faster than in 2000. That progress, when combined with selection for high milkfat and protein bulls, has quickly changed the component levels in the nation’s milk supply.
The change in milk components will only continue given that consumers are eating their dairy products, placing constant incentives in producer milk checks for higher solids. That, of course, will hold true if current consumer demand patterns for dairy products stay the course.
Overall, advances in our knowledge of dairy genetics, combined with new capabilities in reproductive techniques, have hugely accelerated the ability of dairy farmers to create better cows designed to match supply with demand all while improving farm profitability. We not only can compress the time it takes to achieve genetic-based improvements, we can more specifically target what we want in a new heifer calf compared to its dam and be certain we got it within days of that calf being born.


