The author is a professor emeritus at University of Illinois, Urbana.
Questions are arriving from around the globe, inquiring about strategies to reduce feed costs given $7 to $8 per bushel corn and soybean meal over $460 a ton. One approach taking place — but one I disagree with — is to save your way by lowering feed costs and reducing key ration ingredients to maintain profitability. With milk prices over $24 per hundredweight (cwt.), milkfat at $3.15 a pound, and milk protein at $3.42 a pound, reducing milk or component yield is not an economically sound choice.
Focusing on feed ingredients
If you want to monitor feed costs, you need to measure feed costs. Table 1 lists a feed ingredient budget with each feed category, the amount on a dry matter (DM) basis, cost per pound of dry matter, and total costs for that feed category. My strategies to control or even lower costs are as follows.
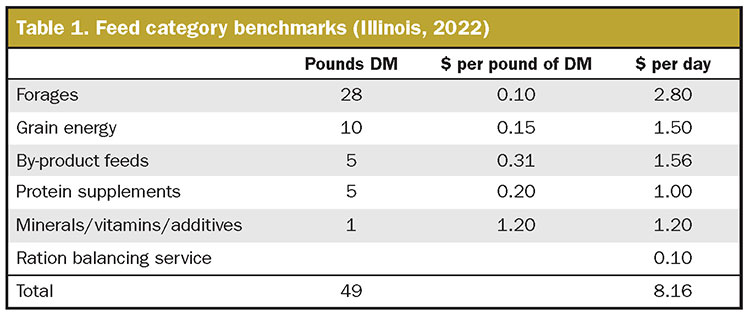
In the forage category, 67% of the total forage dry matter is corn silage and 33% legume, grass, or small grain forage, which could be provided by pasture. Corn silage is the most economical forage source in Illinois. Not only does it reduce corn grain purchases, but it is low in protein, helping to avoid excessive rumen degraded protein that may not be captured by rumen microbes and removed by kidneys as blood urea nitrogen or milk urea nitrogen.
In the by-product feeds category, 50% is fuzzy cottonseed and 50% is corn gluten feed. Fuzzy cottonseed is selling above break-even price when compared to on-farm prices. However, fuzzy cottonseed complements corn silage with physical effective neutral detergent fiber (NDF) and provides fatty acids that are released gradually during rumination and chewing, lowering negative effects of polyunsaturated fatty acids (PUFA). Corn gluten feed is a low-priced nutrient as sourced in Illinois.
In the protein category, 50% is soybean meal, and it is currently cheaper than canola meal. Soybean meal also could be heat treated to boost rumen undegraded protein (RUP) with higher levels of lysine and paired with 50% corn distillers grain, a competitive-priced feed ingredient providing RUP, methionine, and oil as an energy source.
Dairy farmers will be challenged in 2022 as they may be feeding forages and corn grain produced in 2021 with lower input costs. When on-farm inventory ends, higher fuel and fertilizer costs will significantly impact 2022 feed budgets.
Evaluate economic measures
Table 2 provides four measurements, including feed cost per pound of dry matter, cost per cwt. of milk, income over feed costs, and feed efficiency. Each feed measurement provides valuable comparisons when evaluating feed costs.
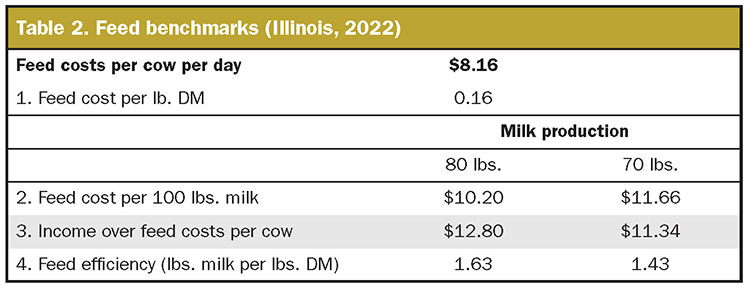
Feed cost per pound of dry matter reflects the selected feed ingredients and amount when building the ration. Higher levels of corn, protein supplements, legume or grass forage, rumen inert fats, rumen-protected amino acids, and feed additives can elevate this figure. This value is regionally impacted and varies due to your location.
Feed costs per 100 pounds of milk reflect the cost of dry matter intake of the herd or group of cows, level of forages, feed shrink at the feedbunk, weigh backs, and current milk yield. This value will penalize you if one reduces milk yield in Table 2.
Income over feed costs (IOFC) is a value used by both dairy farmers and nutritionists to indicate how much money is available to pay other bills on the farm. It can reflect profitability after paying the feed costs. The limitation is current milk prices have a major impact on this value, which cannot be controlled or managed by the dairy farmer.
Dairy farmers should have a minimum IOFC target value based on their herd size, fixed cost, and variable costs. Illinois dairy farmers needed an IOFC between $10 to $12, but the value will be higher in 2022 as labor, fuel, and fertilizer prices have all gone up.
Feed efficiency is my favorite value as it reflects how your cows convert pounds of dry matter intake to pounds of 3.5% fat or energy-corrected milk. This number does not include shrink or refusals. Important factors will impact feed efficiency, including milk yield in the herd or groups, grouping pattern in the herds, fertility (days in milk), number of young cows (adds a growth requirement for additional nutrients), rumen digestibility, disease such as elevated somatic cell counts, metabolic disorders, and higher maintenance requirements (walking distances to the milking parlor or pasture and heat stress). In Table 2, feed costs do not impact feed efficiency.
Each measurement brings unique value to evaluate and manage. While one value is optimal or correct for a herd, it allows you to make comparisons in your county or region. Feed cost per pound of dry matter can be higher in western states due to higher feed transportation costs involved with moving corn or soybean meal west, but higher milk yields favor lower feed costs per 100 pounds.
Another key factor shown in Table 2 is a direct comparison when dairy farmers reduce milk yield per cow by 10 pounds. Economic measurements reflect lower profitability and higher cost with lower milk yield.
Comparing measurements
Table 3 contains several years of Illinois values when it was calculated for regional Illinois dairy seminars. It is interesting to track and see how this shift takes place due to feed cost related to drought, milk prices, and other farm factors.
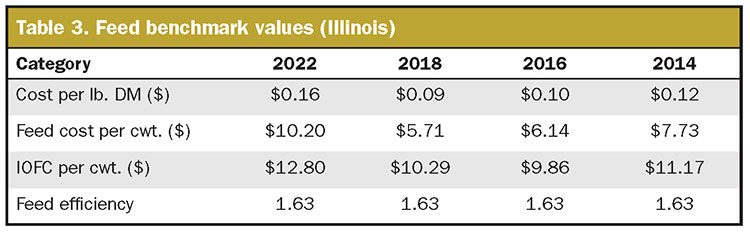
These values should be compared to county, state, and/or regional dairy farms to determine the competitiveness of your dairy farm. Comparisons using a standardized or adjusted milk price have been used by some nutritionists.
For more information on this topic and other options for cutting feed costs without losing milk, review the April Hoard’s Dairyman webinar, “Feed costs: Ten opportunities for savings,” at on.hoards.com/WB_041122.