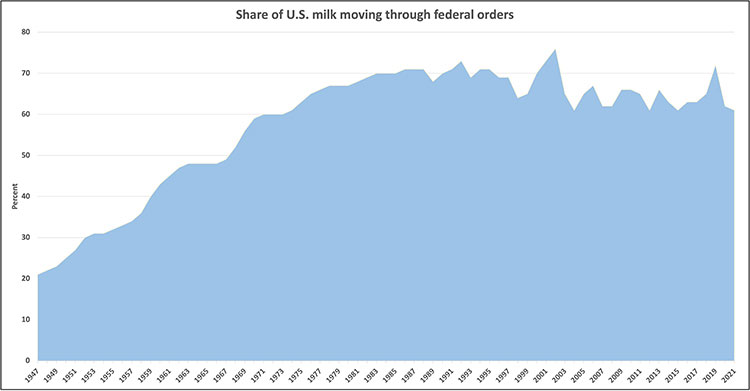
The amount of U.S. milk moving through the Federal Milk Marketing Order (FMMO) system fell to a six-year low in 2021 at 61%. That matched the totals posted in 2004, 2012, and 2015.
Prior to those four moments in time, the share of federal order milk had never been below 61% dating back to 1974. That’s according to data shown in Figure 1 and published in Measures of Growth in Federal Orders by USDA’s Agricultural Marketing Service. Just two years earlier, the amount of annual milk flow moving through FMMOs notched a 72% total. That 19-year high point also coincided with the first full year that California was in the FMMO system.

Tracking Class I beverage milk
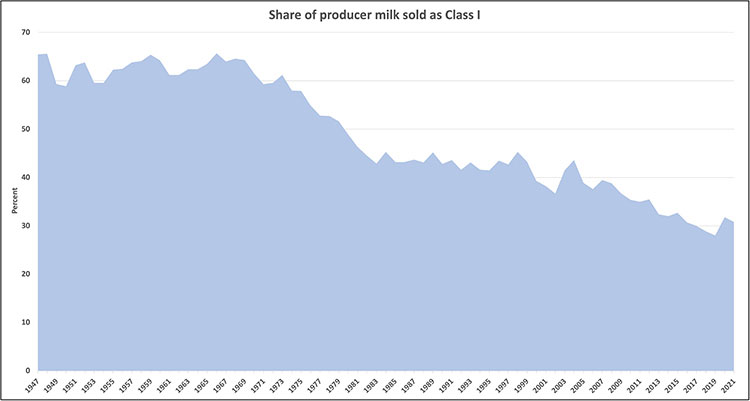
Class I milk, generally the highest priced of the four classes of milk in the FMMO system, totaled just 30.8% of all milk in 2021. That was down from 31.8% the prior year. Overall, the amount of milk coming off the nation’s dairy farms and going into fluid products hasn’t been above 33% since 2012.
Of course, beverage milk sales have been slumping for decades. The trends are shown in Figure 2, and here are some additional highlights when it comes to the share of Class I fluid milk:
- 1947 to 1973 — over 59%, with a peak of 65.7% in 1967
- 1974 to 1979 — ranged from 50% to 58%
- 1980 to 1999 — ranged from 41% to 49%
- 2000 to 2021 — ranged from 28% to 44%


