Are we in a period of across-the-board price increases?
Dumb question, right?
How about the question, “How much are prices increasing?”
That’s a bit trickier question than it sounds.
Of course, the first part is . . . Prices of what? Prices of everything? Input prices? Retail prices?
Or, we might also ask whether we are measuring increases in the absolute, such as 43 cents per pound or on a percentage basis. This can make quite a difference in our perception of what is going on.
For example, if wholesale prices go up, say, 20 cents per pound and retail prices also go up 20 cents per pound, that sounds like an equal increase. However, if the wholesale price is $2 and the retail price is $4, that same 20 cents is 10% at wholesale (movement from $2 to $2.20 per pound) and 5% at retail (movement from $4 to $4.20 per pound).
There are several price indices that are often mentioned in relation to the topic of inflation. How do any of these relate to the specific interests of a dairy farmer or manufacturer? That was the focus of several questions that came into our production studio during the July 20, 2022, Hoard's DairymanDairyLivestream episode, “Where will interest rates and inflation take dairy?”
One longtime viewer, Bill Wavrin from Washington state, asked whether the producer price index (PPI) might be more relevant to a dairyman than the consumer price index (CPI). With a little help from Andrew Novakovic, professor emeritus at Cornell University, let’s look at these two and review what they mean and how they might apply.
“The consumer price index is a measure of retail prices collected by the Bureau of Labor Statistics (BLS) in the U.S. Department of Labor,” shared Novakovic. “The CPI focuses on prices that consumers pay for goods and services. The CPI for cheese, butter, or all dairy looks at retail prices from grocery stores.
“BLS tries to get at a net price, including any generally available discounts, and it tries to get a weighted average of different types of products, package sizes, and the like,” said the regular commentator on DairyLivestream. “The price of cheese or any other food item that we see in a restaurant menu is not represented in the CPI. The CPI does have data for services, including meals eaten outside the home.
“A producer price index is also collected by the BLS. It is a measure of wholesale prices — prices for goods and services sold somewhere in the supply chain before retail,” said the Cornell economist. “There are two different ways that BLS reports wholesale prices. One looks at a bundle of goods sold by a particular industry. They have a PPI for dairy manufacturing that is a weighted average of the output prices for items sold by companies classified under NAICS Code 3115, which is defined as establishments that manufacture dairy products from raw milk, processed milk, and dairy substitutes,” shared Novakovic.
“Another way of slicing the data is by commodity, regardless of who is selling it. There is a PPI for farm products: raw milk. As it sounds, this number focuses on the price for a commodity called raw milk. Not surprisingly, this number is virtually identical to the USDA All-Milk price, expressed as an index,” continued Novakovic.
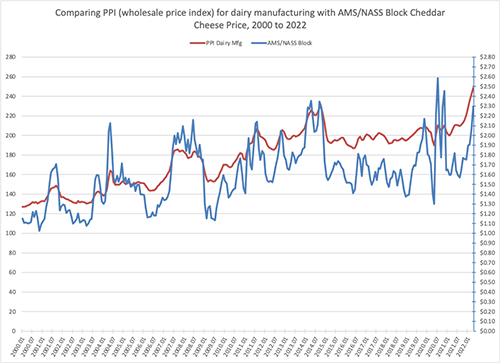
“The graph shown below illustrates what the PPI for dairy manufacturers is picking up,” said Novakovic. “The AMS/NASS (USDA Agricultural Marketing Service/National Agricultural Statistics Service) block cheese price is one we know well. Prices for blocks would be included in the PPI, but of course, it would include a bunch of other dairy foods as well,” he shared. “My point here is to simply illustrate that the PPI is indeed a weighted average index of wholesale prices of a bunch of dairy products, and it behaves (plots out) in a way that makes sense compared to major dairy product prices we know,” he explained.
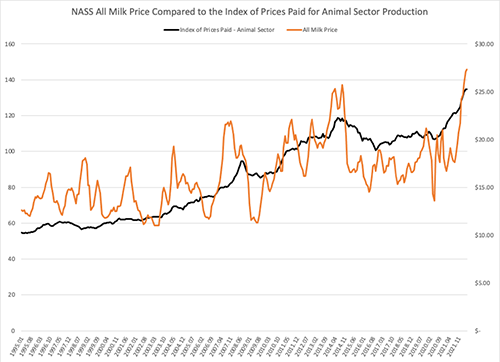
“What gets closer to the more specific question is, ‘How does the increase in my output price compare to the increase in the prices I’m paying for inputs?’ To answer that, one can compare the NASS All-Milk price with its index of prices paid,” shared Novakovic. “There are many different measures in the USDA index, ranging from specific items to broad categories. One grouping it calculates is related to animal sector production. It weights inputs based on usage in animal agriculture. That is shown in the chart below.”
The chart indicates familiar patterns. “The price of one item, milk, tends to be more volatile than the weighted average prices of a bunch of stuff, like the package of inputs used in animal agriculture,” he explained. “Nevertheless, these input prices and the milk price are clearly correlated. Sometimes, demand side factors push the milk price in ways not obviously related to input prices, as we see during the Great Recession. Sometimes there are lags, where input prices rise for a few months before the output price responds, as we have seen this year.”
Novakovic cautioned, “There are a lot of good and useful data out there, but we always have to be careful that we know what is being measured and for what purposes it can be applied in a reasonable and meaningful way.”