As the dairy industry has moved west, it has become more dependent upon groundwater rather than surface water. The question that subsequently arises in many communities is, "Are dairies using all the water?"
Comparing the drinking and other water requirements to that for growing crops on a parcel of land provides part of the answer. In West Texas and New Mexico, many 2,000-head dairies have been built on 160-acre tracts of land. To compare a dairy's water use, we start by determining how much water cows and heifers drink and cleaning equipment requires (Table 1).
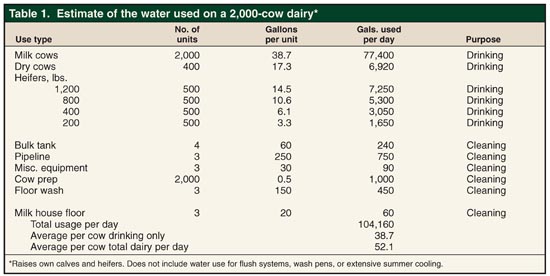
In the example in Table 1, all heifers and dry cows were maintained on the same site which may not always be the case. Thus, the estimate in Table 1 depicts the upper range of animals influencing drinking water requirements for this size herd.
In the example, the herd was being milked 3x. Therefore, the milking equipment was cleaned three times daily. A lot of variability exists in how much water is used in the parlor. For example, training employees to turn off water hoses when not in use helps minimize the use.
Most of the recently constructed dairies in the Great Plains do not have wash pens which can add significantly to the amount of water required. The cow prep procedure in Table 1 is for minimal water usage, without a wash pen.
The next step in comparing the water use of a 2,000-cow dairy is to convert the daily water use of approximately 110,000 gallons per day from Table 1 to an annualized water use by multiplying by 365 days per year. This means that the 2,000-cow dairy with dry cows and heifers needs about 40 million gallons of water annually.
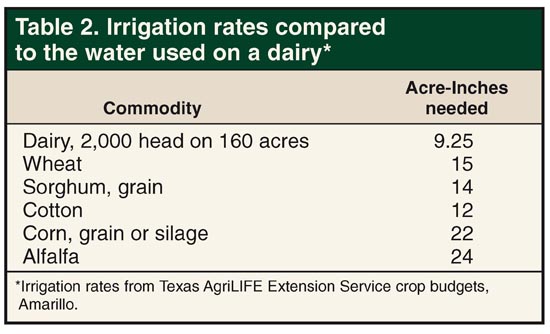
To convert that to acre feet of water required per year, divide 40 million gallons per year by 325,810 gallons per acre foot of water. This means the dairy uses 123 acre feet of water annually on its 160 acres or 9.25 inches per acre per year.
Irrigation rates vary by location, crop, actual precipitation, and method of irrigation. As an example, Table 2 lists the irrigation rates for various crops used in Texas AgriLIFE Extension Service crop budgets. In this instance, the estimated water use for a dairy is less than that of the most commonly grown crops in the area.
Another way to look at this is that the water used in one year on a 2,000-cow dairy situated on 160 acres would irrigate:
• 67 acres of corn silage
• 98 acres of irrigated wheat (grain)
• 123 acres of cotton
Besides the actual water used by the cows on a dairy, the second issue that arises is that the influx of dairies into a region results in higher water use crops being grown. In an attempt to evaluate how water use changes when dairies move into an area, the irrigated cropping patterns in eight counties in the Texas Panhandle were tracked using crop production data from the National Agriculture Statistical Service database from 1995 to 2007 (Figure 1).
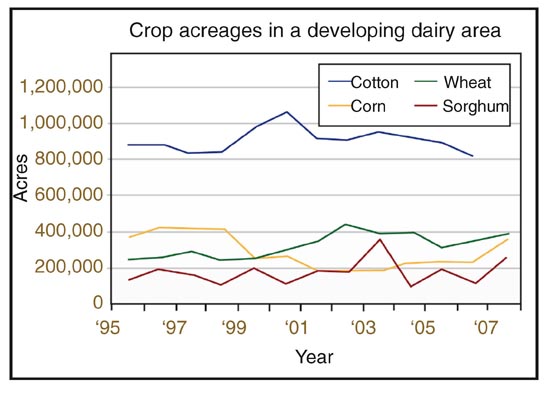
The counties were chosen because they currently have and are projected to have dairy expansion. Dairy growth in this region started in 2000 when there were fewer than 20,000 cows. By 2007, there were nearly 120,000 cows.
The graph shows there is no clear trend in cropping practices. Corn, the highest irrigation water user, actually had more acres grown from 1995 to 1998 than it has since expansion of the dairy industry. It is not clear whether the upswing in corn acres and decline in cotton acres in 2007 reflect greater dairy demand, the movement of ethanol plants into the area, or the higher corn price.
In reality, the citizens of the area are trading uses for water, at least partially dependent upon economic forces. The bottom line is that there is a finite amount of water available. The influx of dairy into a region provides greater diversification of available markets to the crop farmer. A grower's decision to raise different crops depends on the unique situation of the crop farmer and the markets available to him.
Click here to return to the Crops & Forages E-Sources
090810_479
Comparing the drinking and other water requirements to that for growing crops on a parcel of land provides part of the answer. In West Texas and New Mexico, many 2,000-head dairies have been built on 160-acre tracts of land. To compare a dairy's water use, we start by determining how much water cows and heifers drink and cleaning equipment requires (Table 1).
In the example in Table 1, all heifers and dry cows were maintained on the same site which may not always be the case. Thus, the estimate in Table 1 depicts the upper range of animals influencing drinking water requirements for this size herd.
In the example, the herd was being milked 3x. Therefore, the milking equipment was cleaned three times daily. A lot of variability exists in how much water is used in the parlor. For example, training employees to turn off water hoses when not in use helps minimize the use.
Most of the recently constructed dairies in the Great Plains do not have wash pens which can add significantly to the amount of water required. The cow prep procedure in Table 1 is for minimal water usage, without a wash pen.
The next step in comparing the water use of a 2,000-cow dairy is to convert the daily water use of approximately 110,000 gallons per day from Table 1 to an annualized water use by multiplying by 365 days per year. This means that the 2,000-cow dairy with dry cows and heifers needs about 40 million gallons of water annually.
To convert that to acre feet of water required per year, divide 40 million gallons per year by 325,810 gallons per acre foot of water. This means the dairy uses 123 acre feet of water annually on its 160 acres or 9.25 inches per acre per year.
Irrigation rates vary by location, crop, actual precipitation, and method of irrigation. As an example, Table 2 lists the irrigation rates for various crops used in Texas AgriLIFE Extension Service crop budgets. In this instance, the estimated water use for a dairy is less than that of the most commonly grown crops in the area.
Another way to look at this is that the water used in one year on a 2,000-cow dairy situated on 160 acres would irrigate:
• 67 acres of corn silage
• 98 acres of irrigated wheat (grain)
• 123 acres of cotton
Besides the actual water used by the cows on a dairy, the second issue that arises is that the influx of dairies into a region results in higher water use crops being grown. In an attempt to evaluate how water use changes when dairies move into an area, the irrigated cropping patterns in eight counties in the Texas Panhandle were tracked using crop production data from the National Agriculture Statistical Service database from 1995 to 2007 (Figure 1).
The counties were chosen because they currently have and are projected to have dairy expansion. Dairy growth in this region started in 2000 when there were fewer than 20,000 cows. By 2007, there were nearly 120,000 cows.
The graph shows there is no clear trend in cropping practices. Corn, the highest irrigation water user, actually had more acres grown from 1995 to 1998 than it has since expansion of the dairy industry. It is not clear whether the upswing in corn acres and decline in cotton acres in 2007 reflect greater dairy demand, the movement of ethanol plants into the area, or the higher corn price.
In reality, the citizens of the area are trading uses for water, at least partially dependent upon economic forces. The bottom line is that there is a finite amount of water available. The influx of dairy into a region provides greater diversification of available markets to the crop farmer. A grower's decision to raise different crops depends on the unique situation of the crop farmer and the markets available to him.
090810_479