The author is a retired breed association executive secretary and dairy cooperative CEO.
Without the fat, protein, and other solids, milk has little or no economic value. Today, more than 60 percent of all U.S. milk production is used to produce manufactured products, especially cheese.

Yields of cheese and other manufactured products have improved thanks to higher levels of milk protein and solids-not-fat. There's better milk in the bottle, too.
Cheese yield depends mostly on the amount of protein contained in milk. Nonfat dry milk powder is leading the way in dairy exports from the U.S. Solids-not-fat (SNF) determines how much powder can be made from milk.
Components are important in fluid milk, as well. Consumers purchase fluid milk for its nutritional value and taste, not because it is white water. Milk components provide the nutrition and taste in fluid milk. As consumers continue to purchase lower-fat milks, protein and SNF provide more of the nutrition and taste.
On the farm side, at least one milk component helps determine the price that all U.S. dairy farmers receive for their milk. Two or more milk components are the primary factors in calculating their milk price for more than 75 percent of the nation's milk. Based on these facts, it is important the dairy industry knows what is happening to component levels.
There is not a single source that publishes national milk component level averages. Granted, the National Agricultural Statistics Service releases national and state fat percentage data, but they are estimates. Each federal order and the state of California collect and publish actual component data for the milk they regulate.
Unfortunately, all federal orders and California do not collect and publish data for all milk components. For example, California only publishes fat and SNF. SNF is protein plus other solids. The six orders using multiple component pricing (MCP) have fat, protein, and other solids data. The other orders have fat information.

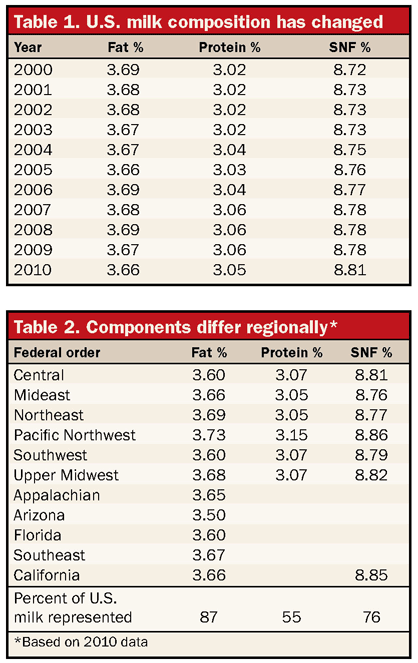
Table 1 shows the results of combining the component data from federal orders and California for the years 2000 through 2010. The fat percentage represents about 87 percent of the nation's milk production in 2010. The SNF average is about 76 percent and protein is 55 percent of national milk production in 2010.
Between 2000 and 2010, fat levels declined from 3.69 to 3.66 percent, while protein rose from 3.02 to 3.05 percent. SNF jumped almost a full point from 8.72 percent to 8.81. These results represent good news. A higher level of protein in a hundredweight of milk means more pounds of cheese per hundredweight of milk. Yes, fat levels declined, but a higher ratio of protein to fat in milk is more desirable when making cheeses such as mozzarella compared to Cheddar. This is even more important when production of lower-fat cheeses is growing at a greater rate than Cheddar.
The large gain in SNF percentages means the average yield of nonfat dry milk powder per hundredweight of milk went up almost one-tenth of a pound. This may not sound like a significant yield gain, but with the size of today's drying plants, this is a big number.
The change in milk component levels also has implications for fluid milk, as well. Fluid processors must remove cream from raw milk to meet consumer demand. A lower fat content of raw milk means less cream for fluid processors to remove. Higher SNF percentages improve both the nutritional value and taste of milk. For those advocating legislation to raise the minimum required SNF percent in retail fluid milk, the nation's dairy farmers already are doing so without legislation.
There are significant regional differences in milk component levels. This is shown in Table 2. As discussed previously, only the six federal orders pricing milk using MCP have data for all three components.
The highest milk component levels are found in the Northwest. The Pacific Northwest order showed 2010 average component levels for fat, protein, and SNF of 3.73 percent, 3.15 percent, and 8.86 percent, respectively. California's SNF is a close second at 8.85 percent. On the other hand, protein levels in the Mideast Order and Northeast Order are 3.05 percent.
To put this protein difference in perspective, consider two cheese plants, one in the Northwest and one in the Mideast. Each plant receives average milk and wants to produce 400,000 pounds of cheese per day. The Mideast cheese plant would need to receive two more tankers of milk per day, compared to the Northwest plant.
All six orders using multiple component pricing saw protein levels rise between 2000 and 2010, with the Pacific Northwest showing the greatest gain. In 2000, protein percent in that marketing area was 3.02, and in 2010 it was 3.15. California saw its average SNF percent rise from 8.75 in 2000 to 8.85 in 2010. Higher component levels on the West Coast no doubt are due to several factors including: cheese plants encouraging and rewarding the production of higher component milk, a greater rise in proportion of the protein breeds, and California including SNF in its milk payment plan since the 1960s.
Looking ahead
The federal orders with protein and SNF data, including California, are the areas of the country with most of the nation's dairy manufacturing. Protein and SNF levels are rising in these areas which is good news for the dairy manufacturing industry. The rise is more significant due to the MCP plan used to price the majority of the nation's milk. The plan encourages production of total pounds of milk components, not component levels.
Dairy farmers need to be given a greater economic incentive to boost the component level in their milk production. Higher component levels bolster manufacturing yields, thus improving plant efficiency and profitability. As more milk is used in manufacturing, this becomes more important economically. And, with growing interest and emphasis on sustainability, higher milk component levels aid in this effort. This incentive can be accomplished by including a factor in milk pricing that recognizes the concentration of milk components.
In addition, MCP needs to be extended to fluid markets. Dairy farmers in those markets need the economic incentive to improve milk components, as well. Maybe improving fluid milk's nutrition and taste can help stop declining fluid milk sales.

Cheese yield depends mostly on the amount of protein contained in milk. Nonfat dry milk powder is leading the way in dairy exports from the U.S. Solids-not-fat (SNF) determines how much powder can be made from milk.
Components are important in fluid milk, as well. Consumers purchase fluid milk for its nutritional value and taste, not because it is white water. Milk components provide the nutrition and taste in fluid milk. As consumers continue to purchase lower-fat milks, protein and SNF provide more of the nutrition and taste.
On the farm side, at least one milk component helps determine the price that all U.S. dairy farmers receive for their milk. Two or more milk components are the primary factors in calculating their milk price for more than 75 percent of the nation's milk. Based on these facts, it is important the dairy industry knows what is happening to component levels.
There is not a single source that publishes national milk component level averages. Granted, the National Agricultural Statistics Service releases national and state fat percentage data, but they are estimates. Each federal order and the state of California collect and publish actual component data for the milk they regulate.
Unfortunately, all federal orders and California do not collect and publish data for all milk components. For example, California only publishes fat and SNF. SNF is protein plus other solids. The six orders using multiple component pricing (MCP) have fat, protein, and other solids data. The other orders have fat information.

Table 1 shows the results of combining the component data from federal orders and California for the years 2000 through 2010. The fat percentage represents about 87 percent of the nation's milk production in 2010. The SNF average is about 76 percent and protein is 55 percent of national milk production in 2010.
Between 2000 and 2010, fat levels declined from 3.69 to 3.66 percent, while protein rose from 3.02 to 3.05 percent. SNF jumped almost a full point from 8.72 percent to 8.81. These results represent good news. A higher level of protein in a hundredweight of milk means more pounds of cheese per hundredweight of milk. Yes, fat levels declined, but a higher ratio of protein to fat in milk is more desirable when making cheeses such as mozzarella compared to Cheddar. This is even more important when production of lower-fat cheeses is growing at a greater rate than Cheddar.
The large gain in SNF percentages means the average yield of nonfat dry milk powder per hundredweight of milk went up almost one-tenth of a pound. This may not sound like a significant yield gain, but with the size of today's drying plants, this is a big number.
The change in milk component levels also has implications for fluid milk, as well. Fluid processors must remove cream from raw milk to meet consumer demand. A lower fat content of raw milk means less cream for fluid processors to remove. Higher SNF percentages improve both the nutritional value and taste of milk. For those advocating legislation to raise the minimum required SNF percent in retail fluid milk, the nation's dairy farmers already are doing so without legislation.
There are significant regional differences in milk component levels. This is shown in Table 2. As discussed previously, only the six federal orders pricing milk using MCP have data for all three components.
The highest milk component levels are found in the Northwest. The Pacific Northwest order showed 2010 average component levels for fat, protein, and SNF of 3.73 percent, 3.15 percent, and 8.86 percent, respectively. California's SNF is a close second at 8.85 percent. On the other hand, protein levels in the Mideast Order and Northeast Order are 3.05 percent.
To put this protein difference in perspective, consider two cheese plants, one in the Northwest and one in the Mideast. Each plant receives average milk and wants to produce 400,000 pounds of cheese per day. The Mideast cheese plant would need to receive two more tankers of milk per day, compared to the Northwest plant.
All six orders using multiple component pricing saw protein levels rise between 2000 and 2010, with the Pacific Northwest showing the greatest gain. In 2000, protein percent in that marketing area was 3.02, and in 2010 it was 3.15. California saw its average SNF percent rise from 8.75 in 2000 to 8.85 in 2010. Higher component levels on the West Coast no doubt are due to several factors including: cheese plants encouraging and rewarding the production of higher component milk, a greater rise in proportion of the protein breeds, and California including SNF in its milk payment plan since the 1960s.
Looking ahead
The federal orders with protein and SNF data, including California, are the areas of the country with most of the nation's dairy manufacturing. Protein and SNF levels are rising in these areas which is good news for the dairy manufacturing industry. The rise is more significant due to the MCP plan used to price the majority of the nation's milk. The plan encourages production of total pounds of milk components, not component levels.
Dairy farmers need to be given a greater economic incentive to boost the component level in their milk production. Higher component levels bolster manufacturing yields, thus improving plant efficiency and profitability. As more milk is used in manufacturing, this becomes more important economically. And, with growing interest and emphasis on sustainability, higher milk component levels aid in this effort. This incentive can be accomplished by including a factor in milk pricing that recognizes the concentration of milk components.
In addition, MCP needs to be extended to fluid markets. Dairy farmers in those markets need the economic incentive to improve milk components, as well. Maybe improving fluid milk's nutrition and taste can help stop declining fluid milk sales.
This article appears on page 115 of the February 25, 2012 issue of Hoard's Dairyman.


