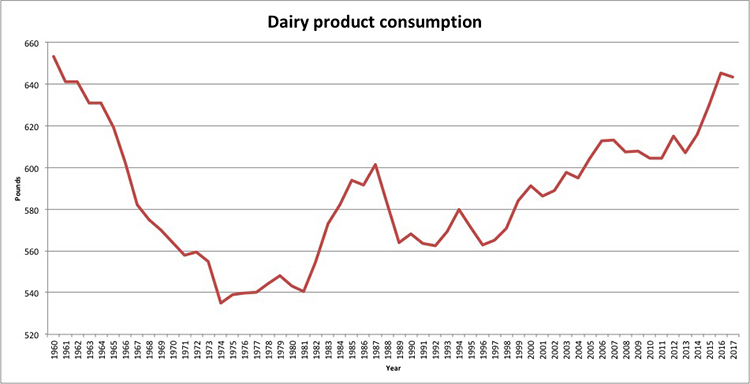
A 2-pound drop in per capita dairy product consumption marks the first decline in domestic consumption since 2012 and 2013. Overall, dairy product consumption fell from 645 to 643 pounds for every American when comparing 2016 and 2017 data.
Even so, dairy sales remain on a steady climb as the 643-pound mark represented the second-highest total in the data series since 1960 when every American consumed 653 pounds of dairy products during the year.
These projections are all based on data compiled by USDA’s Economic Research Service (ERS).

Product consumption
Italian and other cheese: 21.9 pounds per person in 2017; 15.5 pounds in 1997; 6.8 pounds in 1977. (Note, to reach full milk equivalent, multiply pounds of cheese by a factor of 10.)
American cheese: 15.1 pounds in 2017; 11.8 pounds in 1997; 9.2 pounds in 1977. (Note, to reach full milk equivalent, multiply pounds of cheese by a factor of 10.)
Yogurt: 13.7 pounds in 2017; 5.7 pounds in 1997; 2.3 pounds in 1977.
Butter: 5.7 pounds in 2017; 4.2 pounds in 1997; 4.3 pounds in 1977.
Cottage cheese: 2.1 pounds in 2017; 2.6 pounds in 1997; 4.6 pounds in 1977.
Regular ice cream: 12.7 pounds in 2017; 15.5 pounds in 1997; 4.4 pounds in 1977.
Reduced fat ice cream: 6.7 pounds in 2017; 7.2 pounds in 1997; 6.6 pounds in 1977.
Nonfat dry milk and skim milk powder: 2.8 pounds in 2017; 3.3 pounds in 1997; 17.3 pounds in 1977.
Condensed and evaporated milk: 1.7 pounds in 2017; 2.5 pounds in 1997; 4.3 pounds in 1977.
For more details on fluid milk, click to read:
“Fluid milk consumption falls to a 75-year low.”


