Over the last year, a great deal of discussion has surrounded the identity of milk and what products can bear the actual name “milk.” For those of us in the dairy community, it is a pretty simple conversation. If it doesn’t lactate, then it can’t produce milk.
This discussion is the newest layer of the long-standing concern over declining fluid milk consumption. Prior to the current debate, there was the outrageous efforts (from the dairy community’s perspective) made by former First Lady Michelle Obama to take chocolate milk out of school lunch programs.
The list goes on. For years, fluid milk has been under attack by marketing, politics, and consumer fads . . . just to name a few.
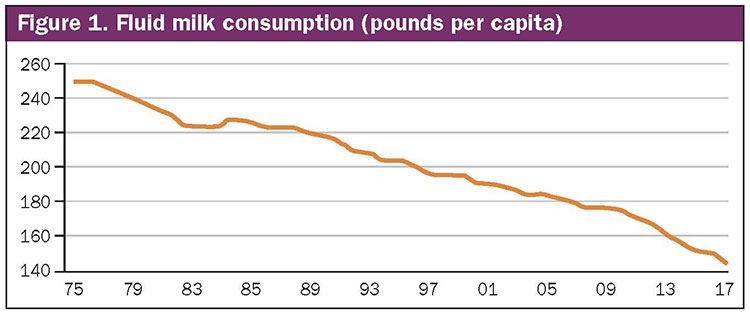
In the end, U.S. per capita fluid milk consumption has continued to evaporate as shown in Figure 1. This figure includes all fluid milk sales for beverage milk such as whole, reduced fat, low-fat, skim, flavored, buttermilk, eggnog, and miscellaneous categories. It’s based on USDA’s latest Dairy products, Per capita consumption report.
FLUID FREE FALL
In the last four years, fluid milk consumption per person has dropped 10 pounds, an approximate 6 percent reduction. In the last eight years, fluid milk consumption per capita has dropped 16 percent, a total of nearly 30 pounds per person. Five of those pounds were evaporated from 2016 to 2017 alone. This is an alarming trend for milk markets.
MUST MAKE UP GROUND
What is not consumed in one category must be made up for in another. Fortunately, the loss of fluid consumption has been overcome by other products. In total, U.S. consumers ate and drank 643 pounds of milk on a milkfat-corrected basis in 2017. That’s 38 pounds more than in 2010 . . . but 2 pounds less than in 2016.
As domestic consumption flattens out, balancing supply and demand requires greater export sales or a reduction in the milk supply from dairy farms. There has been much talk in recent months about the growth in exports and the opportunities that may be presented from new deals with our trading partners.
Surprisingly, despite all of the political posturing, enacted tariffs, and relational strife, trade continued to grow by a rate of about 15 percent. With this growth rate, U.S. milk production would have to rise by 1.5 percent just to keep up with foreign demand.
The forecast for now is that total U.S. exports will account for about 17 percent of U.S. milk production. So, how can inventories of product continue to grow when domestic milk production is only slated to climb by approximately 1.1 percent in 2018?
FLUID FLOODS EXPORTS
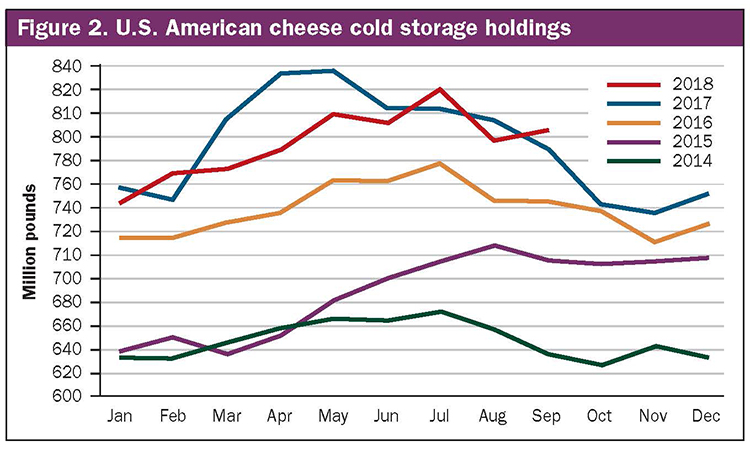
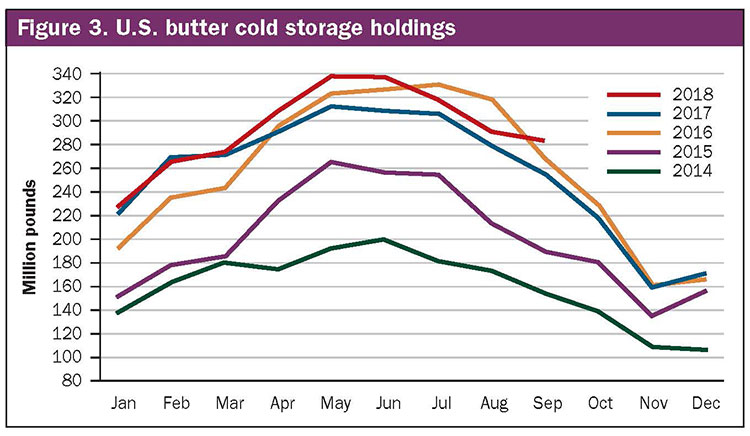
This is exactly where declining fluid consumption steps into the conversation. Further fallout in fluid milk consumption like that experienced in 2017 will equate to an approximate 0.8 percent reduction in aggregate domestic demand. After considering this trend, it becomes obvious why other product categories continue to see inventory growth. Take a look at Figures 2 and 3 (cheese and butter inventory charts). Throw in less competitive exchange rates caused by a strengthening U.S. dollar along with unresolved trade conflicts, and you have a recipe for more of the same as we head into 2019.
When and how we turn around the issue of declining fluid milk consumption in this country remains to be seen. However, if we do not rectify this problem, markets will continue to feel the pressure of ample supplies. Consequently, producers are well-advised to address the market risk that exists as a result.