The Federal Milk Marketing Order (FMMO) pool, specifically the financial benefits of the Class I beverage market, has often been described as a golden goose. For decades, the returns from the Class I market have been used to pay higher prices for milk that is typically intended for manufacturing classes of milk — effectively preserving a reserve supply of milk. The economic benefits of these revenue-sharing pools, however, have changed due to mounting milk supplies and lower utilization of fluid milk.
 John Newton
Chief Economist, AFBF
Each year, approximately 40 billion pounds of milk flows into fluid channels, and the rest flows into cheeses, butter, and other manufactured dairy products. With so much manufacturing milk on the pool, the hundreds of millions of Class I dollars in the FMMO pool are being spread thinner and thinner — lowering farm gate prices across the U.S.
RIDING THE POOL
The problem here is that FMMOs are increasingly becoming the regulatory home for most of the milk production in the U.S., which is not what they were designed to be at the onset. Rather, FMMOs were designed to promote orderly marketing in fluid milk through classified pricing and revenue-sharing pools. Through this pricing system, the proceeds from the fluid market Class I differentials are shared among all producers pooling in the order.
Farmers supplying manufacturing plants stand ready to balance the beverage market when milk supplies are long, or supply supplemental milk when supplies are short, and in exchange these farmers get a slice of the FMMO pie.
The question is, how much milk is really needed as a reserve supply to the fluid market?
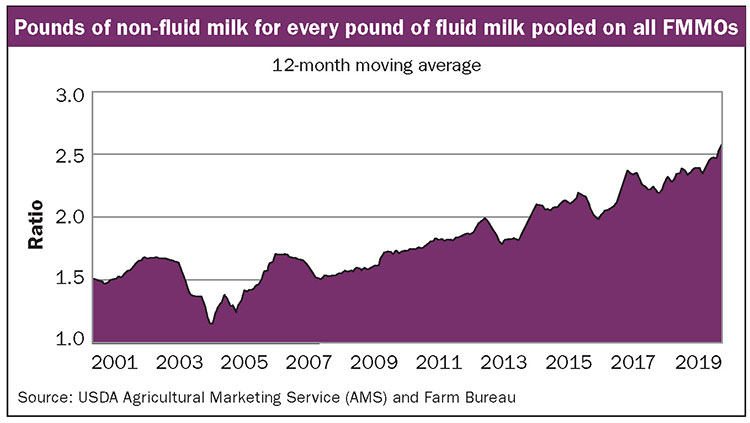
Prior to 2009, there were approximately 1.5 pounds of manufacturing or non-Class I milk pooled in the FMMO for every 1 pound of fluid milk as shown in the figure. Today, we are quickly approaching 3 pounds of non-fluid milk for every 1 pound of fluid milk. In some marketing orders there is even more manufacturing milk “riding” the pool.
For example, year-to-date in 2019, the Pacific Northwest order has had more than 4 pounds of manufacturing milk for every 1 pound of fluid milk pooled. In the Upper Midwest, there were more than 13 pounds of manufacturing milk for every 1 pound of fluid milk pooled in 2019.
With fluid milk consumption nearing a plateau and more milk expected to come online, FMMO pools will be further diluted by more manufacturing milk. By 2028, U.S. production is projected to reach 250 billion pounds; if 80 percent is pooled and Class I use continues on the current trend, we could have 4 pounds of non-fluid milk pooled for every 1 pound of fluid milk — well above what some would consider a reserve supply of milk.
IMPACT ON MILK CHECKS
As the volume of manufacturing milk supplies grows on the FMMO pool, the difference between the producer milk value and the handler obligations in the pool — known as the Class I contribution — shrinks. Dairy farmers see this directly in their milk check in the form of lower producer price differentials (PPD).
For example, the weighted average PPD across component pricing orders has been below $1 per hundredweight for more than 50 consecutive months. What’s more, the moving average is trending lower each year. As a result, the golden goose of a Class I market means less and less with every additional pound of manufacturing milk pooled in FMMOs.
If less manufacturing milk were in the FMMO pools, then the financial returns of the pool would be higher, benefiting producers who directly service the Class I fluid market. This is what occurs in marketing orders with higher qualification criteria.
For example, in the Florida marketing order, Class I utilization is above 80 percent. Producers must touch base or deliver to a fluid plant 10 days a month, and as a result there is less than one-quarter of a pound of manufacturing milk in the pool for every pound of fluid milk.
In the Southeast, Class I utilization is above 70 percent and, like Florida, there is less than one-quarter of a pound of manufacturing milk riding the pool. In these orders, diversion limits are lower, touch-base days are higher, and supply plant qualification is higher than in predominantly manufacturing-based orders.
What would happen if, in our efforts to modernize the FMMO, we revisited the original intent of the order program crafted 90 years ago?
We should ask ourselves, do federal orders need to regulate most of the milk in the U.S, or can it regulate the 25 percent in the fluid market plus a reasonable reserve supply . . . say up to 40 percent of the U.S. supply?
Significantly tightening qualification criteria and eliminating transportation subsidies might do the trick — effectively making the hurdles to supply the Class I market high enough to deter pool riding. The PPD would jump big time if less manufacturing milk were in the pool.
What about those dairy farmers not servicing the Class I market?
In areas where the PPD has been watered down, they may not notice. In other areas, there may be enhanced competition to perform for the Class I market. Efficiencies could be gained, and higher quality standards could be achieved.
In unregulated areas, milk pricing could be simplified and free market efficiencies discovered. Oh, and by the way, federal orders would go back to the basics of facilitating orderly marketing with a wholesome and adequate supply of milk for the Class I market.