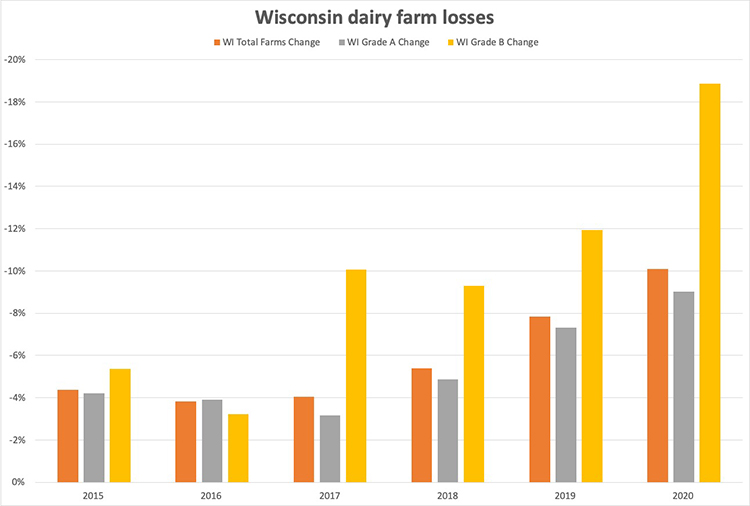
Wisconsin lost 10.1% of its dairy farms during 2019. However, those losses were disproportional and directly depended on the type of market served — Grade A or Grade B dairy farms.
Of the Wisconsin farms selling out in 2019, 167 Grade B farms left the dairy business for an attrition rate of 18.9%. In comparison, only 9% of Wisconsin’s Grade A farms sold out during 2019. As a point of information, Wisconsin had 6,574 Grade A farms and 718 Grade B farms in January 2020, as noted in the Hoard’s Dairyman Intel “Wisconsin farm losses not exactly historic.”
Grade B farms can only sell milk for manufactured dairy products; that milk can never be used for beverages sold in stores. The farmers producing Grade B milk get paid at a lower rate than their Grade A counterparts.
The federal government began enacting provisions of the Pasteurized Milk Ordinance (PMO) in 1924 to govern the interstate shipment of milk. However, the word “Grade A” first began appearing in the 1965 PMO, and that’s when most farms began converting to Grade A standards.
A four-year trend
Grade B farm numbers have been dropping dramatically in Wisconsin. In the past four years, here is a comparison between Grade B and Grade A dairy operations:
January 1, 2020 — 718 Grade B farms, 167 left business, 18.87%
January 1, 2019 — 885 Grade B farms, 120 left business, 11.94%
January 1, 2018 — 1,005 Grade B farms, 103 left business, 9.30%
January 1, 2017 — 1,108 Grade B farms, 124 left business, 10.06%
January 1, 2020 — 6,574 Grade A farms, 651 left business, 9.01%
January 1, 2019 — 7,225 Grade A farms, 571 left business, 7.32%
January 1, 2018 — 7,796 Grade A farms, 400 left business, 4.88%
January 1, 2017 — 8,196 Grade A farms, 267 left business, 3.15%
January 1, 2020 — 7,292 total Wisconsin dairy farms, 818 left business, 10.09%
January 1, 2019 — 8,110 total Wisconsin dairy farms, 691 left business, 7.85%
January 1, 2018 — 8,801 total Wisconsin dairy farms, 503 left business, 5.41%
January 1, 2017 — 9,304 total Wisconsin dairy farms, 391 left business, 4.03%
Wisconsin’s dairy counties compared
Dairy cows and farms continue to consolidate into clusters.
In Wisconsin, the top 10 dairy counties based on cow numbers lost 274 of its 2,977 herds for a 9.2% attrition rate during 2019. On the flip side, the remaining 62 counties lost 544 of its 5,133 dairy herds for a 10.6% reduction.
This mirrors national trends.
When evaluating the top 10 dairy states with 900 or more farms, that group lost 6.6% of its farm throughout 2018 (2019 data has not been collected in all states). In the remaining 40 states, losses totaled 7.8%.


