With 84% of all milk in the Upper Midwest Federal Milk Marketing Order heading to the cheese vat, it stands to reason that milk components would hold a higher value in dairy farmer milk checks. That is indeed the case based on the paper Analysis of Component Levels and Somatic Cell Count in Individual Herd Milk at the Farm Level.” With greater demand for components, dairy farmers in this region ship denser milk to processors.
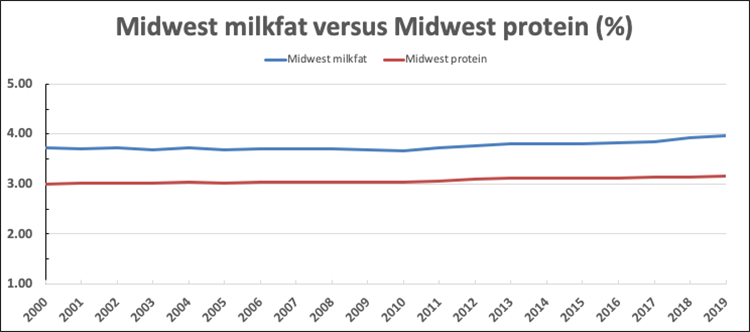
In the paper by Corey Freije, he notes that milk within the order averaged a 3.96% butterfat and a 3.15% protein throughout 2019. By way of comparison, those levels were 3.67% for butterfat and 3.03% for protein just a decade earlier in 2009.
That’s a 0.29% gain for butterfat in 10 years and a 0.12% improvement for protein during the same time.
The chart on butterfat and protein levels illustrates this evolution.
Running above the national average
Milk shipped by dairy farmers in the Upper Midwest order largely comes from Wisconsin and Minnesota. However, there are also dairy farm shippers in eastern North and South Dakota, northern Illinois, northern Iowa, and Michigan’s Upper Peninsula.
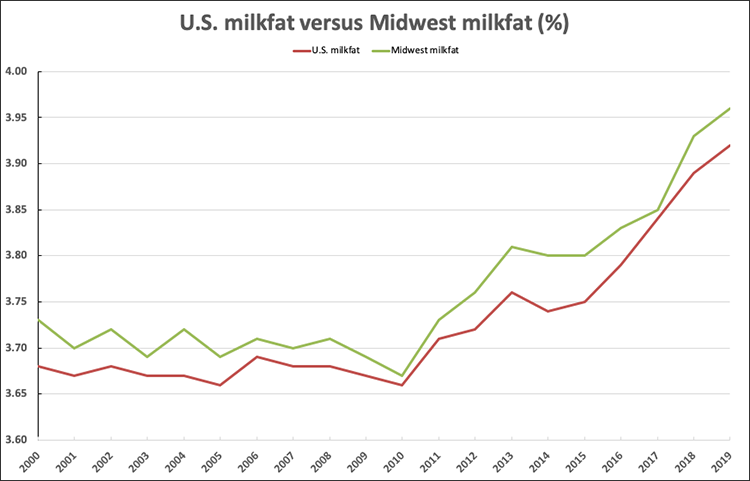
Even though the collective national bulk tank averaged 3.92% butterfat in 2019, as noted in “Dairy fat keeps climbing," the Upper Midwest was slightly higher at 3.96% that same year. In fact, when tracking data back to 2000, the Upper Midwest always averaged 0.01% to 0.05% higher butterfat levels. The Upper Midwest and U.S. are compared in the chart below.