In your September 25, 2020 issue . . .
MILK FUTURES HELD RATHER FIRM through the Labor Day holiday with October-to-December Class III contracts averaging near $17.70 and Class IV at $14.40. That spread still could induce negative producer price differentials (PPDs), but nothing near those in June and July milk checks.
CLASS III FETCHED A $16.50 AVERAGE for the first six months of the new year. Meanwhile. Class IV butter-powder contracts netted $15.30.
AFTER POSTING A RECORD IN JULY, protein dropped from $5.62 to $4.44 in August milk checks. Butterfat slid from $1.96 to $1.63 per pound.
MILK OUTPUT IN NEW ZEALAND could remain on pace with last year. In early September trading at the Global Dairy Trade, cheese held steady at $1.55 per pound and the seven-product mix was off just 1%.
FEED PRICES COULD TREND slightly higher as fields are drying out across the Corn Belt. With reduced yield potential, corn pushed a dime higher to near $3.50 per bushel and soybeans moved to a seven-month high, trading near $9.70. China has stepped up soybean purchases, too.
ALFALFA HAY HELD FIRM near $174 per ton in July, reported USDA. That price was down just $5 from June and was close to April and May. Prices typically drop during the summer as the new crop enters hay sheds.
IN 2019, U.S. DAIRY CASH RECEIPTS rose by 14.9% when compared to 2018. However, not all states improved inbound dairy income as Alabama, Arkansas, Delaware, Louisiana, South Carolina, Tennessee, and West Virginia all reported reductions in cash receipts.
ON THE FLIP SIDE, Colorado, Idaho, Iowa, Michigan, South Dakota, and Texas each had 18% or more gains in cash receipts, reported USDA.
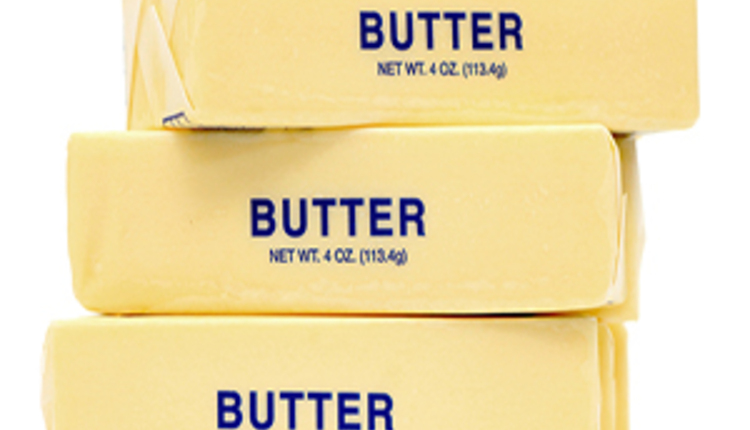
THE BUTTER BOOM CONTINUED as the average American consumed 6.2 pounds of butter in 2019, according to USDA data. The last time butter consumption topped that mark, Lyndon Johnson was the U.S. President. Overall, butterfat sales grew 25% from 2010 to 2019.
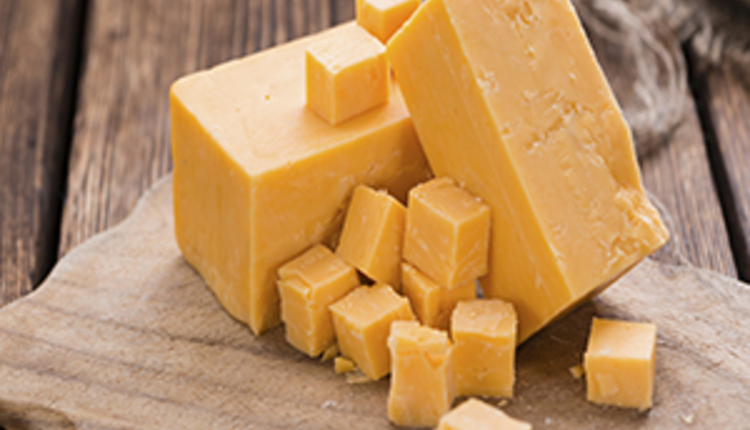
PER CAPITA CHEESE CONSUMPTION grew 17.3% since 2010. 2019’s 38.3 pounds per person total represented a new record in sales.
FLUID MILK CONSUMPTION FELL for the 10th straight year. The 1.8% drop in 2019 sales was the smallest reduction in three years. Skim milk transactions were off 10.7%, while low-fat fell 5.9%.
FLAVORED WHOLE MILK was among the bright spots as sales grew 10.1%. Since 2012, the category has averaged 7.2% annual gains.
THE WINNER WAS WHOLE MILK, which climbed by 1.4%. Nearly 21 times larger in total sales than the flavored whole milk category, the full fat white milk category has posted growth seven straight years.
JULY DAIRY EXPORTS ROSE 23% by volume and 17% by value when compared with last July. Mexico aside, the next nine largest markets all purchased more product. Year-to-date, shipments were up 16% by volume and 14% in dollars. Exports represented 16% of all U.S. milk output.
CALIFORNIA WILL TAKE THE NEXT STEP in potentially sunsetting its quota plan when Judge Timothy Aspinwall presides over a hearing scheduled for September 30 and October 1. That is the same judge that oversaw Stop QIP’s petition to immediately end the quota assessment.
PROPELLED BY ITS ACQUISITION of Dean Foods, Dairy Farmers of America leapfrogged from No. 6 to No. 3 in Rabobank’s annual listing of the world’s largest processors. Nestle stood in the pole position with Lactalis in a close second. Other major North American processors were: No. 10 Saputo, No. 17 Agropur, No. 18 Kraft Heinz, and No. 19 Schreiber Foods.


