The author is a professor emeritus of animal sciences at the University of Illinois, Urbana.

Another measure will be protein efficiency on dairy farms. With high protein feed prices, building rations that improve the conversion of feed protein to milk protein can have economic value.
Milk protein is also the most valued milk solid at $2.50 a pound in July 2021. Consumers will expect improved protein efficiency to reduce nitrogen losses into the environment as urinary nitrogen losses and ammonia gas emissions.
Making the calculation
On-farm protein feed efficiency can be calculated by determining the following values.
1. Calculate the pounds of crude protein consumed by your herd. An example could be 50 pounds of dry matter containing 16.5% crude protein resulting in 8.25 pounds of crude protein consumed per cow per day.
2. Calculate the pounds of true protein produced by your herd. An example could be 75 pounds of milk containing 3.1% true protein (total or crude protein would be 3.3%), resulting in 2.33 pounds of true protein per cow per day.
3. Divide 2.33 pounds of true protein by 8.25 pounds of consumed crude protein, resulting in a protein feed efficiency of 28.2%. This value is typical for dairy herds.
Additional points
Several assumptions were made in these calculations. If total or crude protein content of the milk protein was used, the protein feed efficiency would climb to 30% (3.3% milk protein times 75 pounds of milk divided by 8.25 pounds of feed crude protein).
No adjustment for body weight gain would improve protein efficiency as part of the feed protein was partitioned to tissue replacement. A similar advantage would be for first lactation cows that are growing, leading to added muscle. Likewise, close-up dry cows partition amino acids to fetal growth and colostrum synthesis. Computer modeling programs could fine-tune these calculations, but dairy farmers do not have access to these values to enter into their calculations.
Using the calculations for on-farm protein feed efficiency from our working example, Table 1 demonstrates how protein feed efficiency can be improved by making feeding changes on dairy farms.
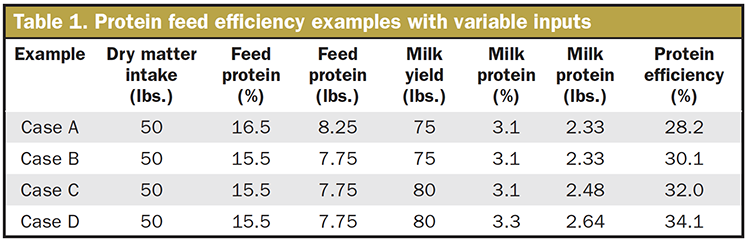
Case A is the same calculation discussed earlier for baseline comparisons. Case B drops feed crude protein by one percentage point from 16.5% to 15.5% by making ration ingredient changes while maintaining milk yield and components. Case C raises milk yield from 75 to 80 pounds of milk through feeding strategies that improve metabolizable protein. Case D elevates the percent true protein from 3.1% to 3.3% by fine-tuning amino acid flow.
Elite dairy farms currently achieve results in Case D. Cornell University researchers suggest that by building rations using primarily corn silage, limited grass hay, heat-treated soybean meal, blood meal, and rumen-protected amino acids, protein feed efficiencies can approach 40%. The New York diet consisted of 46.1% corn silage, 8.5% grass hay, 15.1% finely ground corn, 7.1% corn gluten feed, 7.9% soybean meal, 2.1% soy hulls, 4.1% heat-treated soybean meal, 1.2% molasses, 1.6% palm fatty acid supplement, 0.12% urea, 0.09% rumen protected methionine, 2.18% blood meal, and 3.9% mineral/vitamin premix.
Ration balancing options
Using a rumen modeling program, areas to adjust rations can be identified for improving protein efficiency. Most programs will indicate the level of milk supported by the metabolizable protein (from microbial protein and rumen undegraded protein sources or RUP). The program also will calculate the level of rumen degraded protein (RDP) required.
If the RDP level is over 20 grams of excessive RDP, this nitrogen may be lost in urine excretion and elevated milk urea nitrogen (MUN) levels. To lower the level of RDP, feed ingredient changes will be needed (less haylage high in RDP, for example).
If the RDP level is below requirements, adding more haylage or urea can be considered. If RUP levels are deficient, replacing part of the soybean meal with heat-treated soybean meal is one alternative.
The rumen model program also may predict the level of metabolizable lysine and methionine needed for the target level of milk and milk protein content. If amino acid levels are low, consider alternative feed ingredients (such as blood meal for lysine or corn distillers grains for methionine) or add rumen-protected amino acids.
Six on-farm tools exist
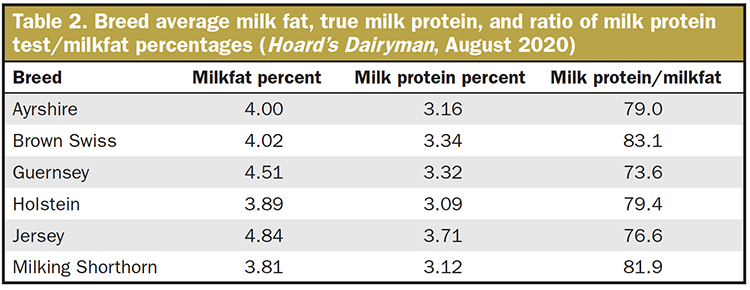
1. Compare your milk protein content to breed averages (Table 2). If your herd milk protein percentage is below the breed average, you have an opportunity to improve milk protein based on breed genetics.
2. If your herd is on a Dairy Herd Information (DHI) testing plan, look for the milk protein percentages in the first 100 days in milk by first, second, and third plus lactation cows. Data from the Dairy Record Management Systems (DRMS) reported lower milk protein content for all Holstein herd milk yield levels and lactation number in the first 100 days in milk. Significant improvements in milk protein may be available in your herd.
3. Compare the ratio of milkfat percentage to milk protein percentage in your herd to breed values in Table 2. As milkfat percent goes up, milk protein percent should climb in a parallel relationship. If milk protein percentage test ratio is less than 75% for Holsteins, examine reasons why milkfat percent is high (feeding extra fat, for example) or milk protein test is low.
4. MUN is another tool to determine if rumen microbes are capturing rumen ammonia from RDP sources as microbial protein or excess ammonia is absorbed across the rumen wall and converted to blood urea nitrogen by the liver. Target MUN levels from 8 to 12 milligrams per deciliter (mg/dL) with lower levels reflecting better protein efficiency.
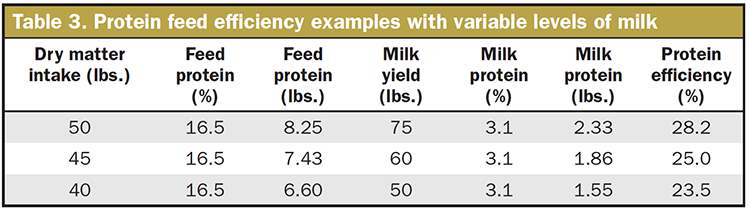
5. Grouping cows by level of milk yield can improve protein efficiency compared to feeding a one group total mixed ration (TMR). Using the base herd values in Table 1, feed efficiencies were calculated at various levels of milk yield and are shown in Table 3. Dry matter intakes were lower as milk yield declined.
6. Management factors also can improve protein efficiency. Michigan State researchers suggested the following improvements can bolster protein efficiency above the herd based protein efficiency (could be 28.2% as listed in the base value). These factors either improve milk yield and/or reduce feed needs.
• Add 0.4 point to be herd base value with a 10% boost in milk yield
• Add 0.5 point by adding one additional lactation number (longevity)
• Add 0.3 point by reducing calving interval by one month
• Add 3.1 points by reducing feed waste by 10%
Varies in humans and cows
Protein feed efficiency as expressed by protein sources that humans cannot consume could be 100% when feeding corn silage, grass forage, hominy, distillers grains, corn gluten feed, and urea. Cornell University research suggests the theoretical maximum is 40% to 45%, while on-farm maximum protein efficiency can reach 38% to 40%.
In the future, efficiencies may be measured as pounds of milk solids per unit of feed dry matter, milk solids per acre (pasture-based systems), and greenhouse gases per pound of milk, cheese, or other dairy products. Efficiency will be key in future dairy farm measurements.