In your October 2021 issue . . .
CLASS III FUTURES CLIMBED NEARLY $1.25 per cwt. for October, November, and December contracts in trading that took place throughout September and early October. That three-month bundle averaged $18.35. January-to-June futures climbed 55 cents to net $17.95.
ALSO GAINING IN A SIMILAR FASHION, October-to-December Class IV contracts rose 60 cents to reach a $17.30 median. Up nearly the same amount, Class IV contracts for the first six months of 2022 netted $17.60.
HIGHER EXPENSES HAVE BEEN ABSORBING those gains. The $12.45 national feed cost in August’s Dairy Margin Coverage (DMC) program was the highest dating back to 2013. This doesn’t consider higher freight, labor, and fuel prices. For more on trucking woes, turn to page 626.
AT $5.25, DMC’S MILK-TO-FEED MARGIN set a new low for the year, being off the previous month by 43 cents per cwt. That, in turn, led to a $4.25 per cwt. payout for farmers buying the maximum $9.50 coverage.
LOWER MILK PRICES AND HIGHER FEED COSTS combined to shrink that margin. Milk fell from $17.90 to $17.70 per cwt. from July to August. Corn climbed 20 cents to reach $6.20 per bushel and blended alfalfa hay rose $5.50 per ton to reach $222, both yearly highs.
SOYBEAN MEAL FELL to its lowest price of the year, based on USDA’s survey data. The $358-per-ton figure was down $7 from one month earlier. Overall, soybean meal has steadily dropped $81 per ton since January.
DAIRY PRODUCT CONSUMPTION IS A BRIGHT SPOT as U.S. per capita consumption grew by 3 pounds during the pandemic. Ice cream, a comfort food, rose 6%. Yogurt and butter also climbed in 2020.
SINCE THE FORMATION OF THE DAIRY CHECKOFF in 1983, per capita consumption, or what an average American consumes in milk equivalent, rose from 573 to 655 pounds. The past 10 years account for 52 pounds of that figure as leaders targeted food vender partnerships.
FOR ONLY THE SECOND TIME SINCE 1994, domestic cheese sales fell. In both instances, it took an economic shock wave to stop the sales ascent. Domestic demand fell 0.5% during the Great Recession of 2008. Likewise, purchases were off 0.1% in 2020 as COVID-19 gripped the world.
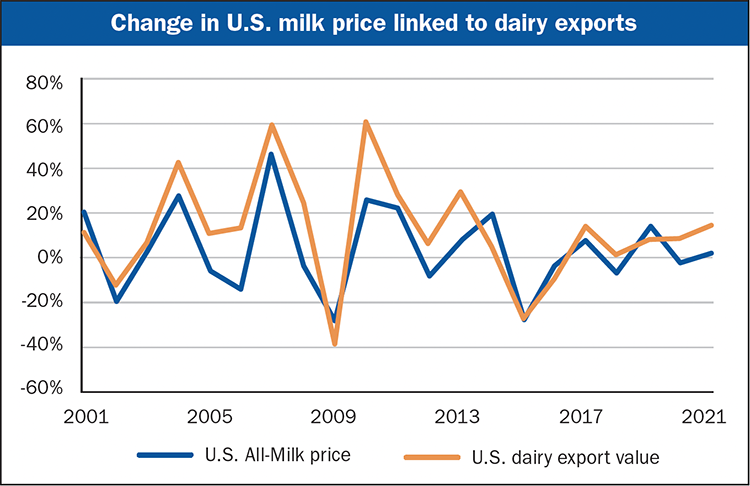
EXPORTS IMPACT MILK CHECKS. As shown in the chart below, the correlation between the percentage change in All-Milk prices and the percentage change in the value of U.S. dairy exports is strong at 0.84.