For decades we have watched as U.S. cow numbers built up quickly in response to favorable market signals while retracting slowly to unfavorable ones. At times, it’s seemed nearly impossible to make cow numbers go down unless under very extreme pressure.
Years ago, I had a client put it to me this way. He said, “As dairymen, when times are good and farm profitability is strong, we milk more cows. And when times are tough and losses seem inevitable . . . we milk more cows.”
Is that still true?
The cow herd journey
Rising milk prices that began in the fall of 2019 inspired dairymen to add 58,000 head from September into February 2020 — a fairly responsive move. As the pandemic unfolded, massive supply chain dislocation caused processors to push back on producers, compelling them to idle or greatly reduce output.
The ripple caused milk buyers to take an unprecedented move toward base programs and other production restricting measures that, in essence, mandated a reduction in cow numbers. After peaking in March 2020 at 9,391,000 head, the U.S. herd would retract 36,000 head by June 2020.
From there, a brighter outlook spurred by enhanced economic activity, hopes for dampened COVID-19 disruption through vaccination, and a record-breaking cheese market run to $3 per pound led to better milk prices and margins heading into 2021. That sparked growth in cow numbers for the next 12 months. In total, cow numbers rose 148,000 head from June 2020 to June 2021, taking the U.S. dairy herd to its highest level since 1994. That expansion represented the fastest herd build since 2008.
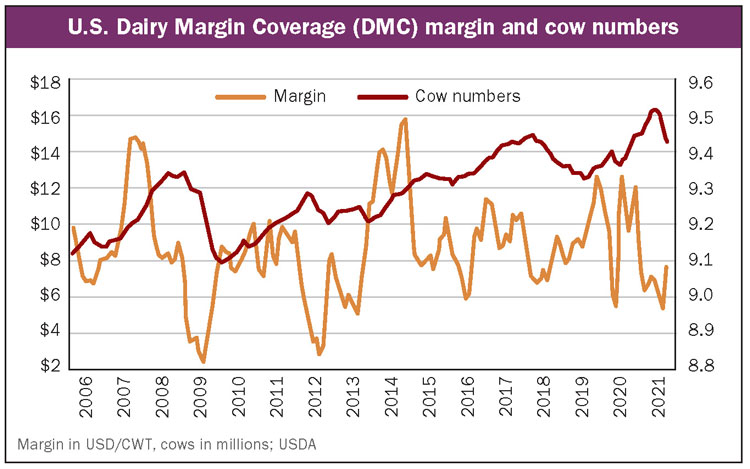
But oh, how quickly things can change. In the third quarter of 2021, cow numbers fell by 81,000 head. Not since 2009 has the herd retracted this quickly. From May to October 2009, the herd retracted by 178,000 head, with three months showing losses of 40,000 or more. In USDA’s September Milk Production report, the combination of an adjustment to August estimates and a reduction in September saw a net loss of 58,000 head.
Fastest build since 2008. Fastest decline since 2009. To quote Yogi Berra, “It’s like déjà vu all over again!” Soaring optimism around a prospering world economy in 2007 and 2008 led markets to move to new historic highs. Remember, this was the time that saw $140 per barrel crude oil. New industries formed. Demand for raw materials accelerated.
With that, rising feed costs quickly caught up with dairymen as the “Great Recession” followed a crumbling housing market and broader market collapse that took milk prices below $10 per hundredweight (cwt.).
We saw similar euphoria in markets this spring as stock markets ran, commodities tested historic values, and investors relished in strong recoveries across major global economies. However, the dairy farm profitability turned dim in summer. High feed prices exacerbated by South American production failures, unprecedented Chinese buying, and unfavorable weather had dairymen scrambling to source “reasonably” priced feed.
While feed values have also come off May to June highs, corn prices for the coming year have “settled in” to the highest price point for this time of year since 2013, a time when margins were also under pressure. Sprinkle in heightened labor costs and labor shortages and there is more expense on the ledger. Add some disruption and elevated cost to all other nonfeed inputs and you have a margin squeeze that started to feel a little bit like 2009.
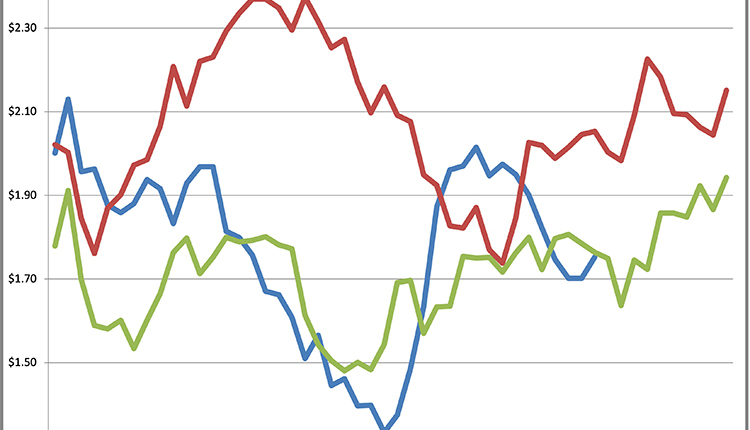
And cows left . . . in a hurry. To state the obvious, margin pressure is not a new experience for dairy. Since 2009, the years of 2012, 2013, 2016, 2018, and 2020 all experienced similar or even worse margins than what we are seeing today as shown in the figure.
The dairy world has changed
Since 2009, a lot has changed. Herds continue to become larger across fewer participants. Insurance products provide improved risk management offerings. The way we manage genetics, culling, and breeding has been revolutionized with sexed semen and beef semen on dairy cows. Quotas or base programs, which forever were taboo in the U.S., have become more common.
In short, we have tightened the circle and expanded our ability to absorb adversity. Up for debate: Do these developments shorten or lengthen the cycles of expansion and contraction?
What is not debatable is the recent hasty decline in cow numbers. In 2009, 249,000 cows left the herd through the course of the year. If we are truly running parallel to that time, there is a long way to go. However, this time around we will not have the likes of a Cooperatives Working Together (CWT) cow culling program to aid in the effort.
But will we repeat?
A quick review of herd expansion and contraction suggests that our largest herd builds generally occur in the first four to five months of the year. This has added to what we call the “spring flush.” What brought cows back into the herd in 2010 was an improved milk price relative to feed costs. In total, 63,000 cows (25% of what was lost in 2009) were added that year.
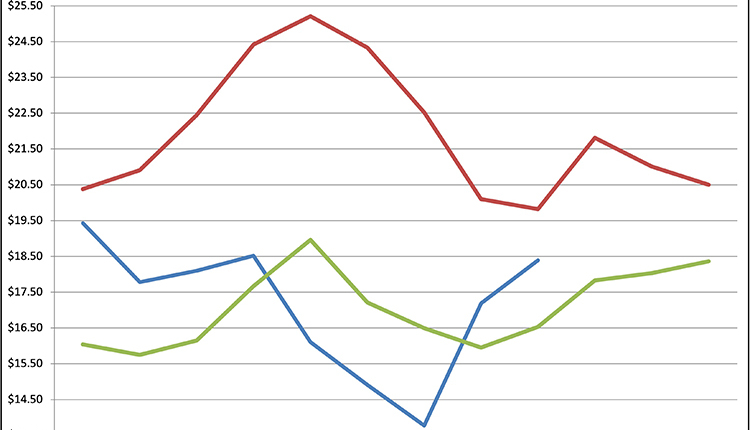
Recently, margins have improved by over $2 per cwt. (see the chart on page 661). Outside of 2014, the 2022 milk futures prices represent the highest first half averages in history. Will the allure of higher milk prices attract greater cow numbers at a time when the industry is prone to growth? Or will the advent of base programs and internal quota systems create equal pushback to this trend?
While market observers watch for answers to these questions, dairymen are encouraged to defend current values. Just as we have seen in previous price cycles, nothing is guaranteed.