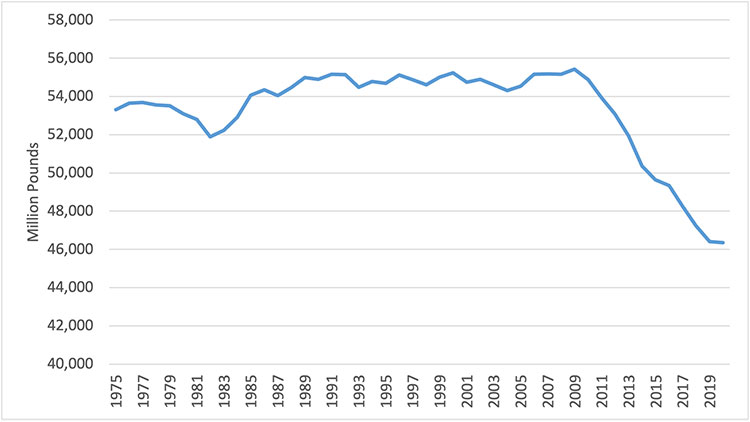
Total beverage milk consumption has been falling precipitously since about 2010. Prior to that period, per capita (per person) consumption had been declining for a long period but population gains had offset those reductions. Overall, total U.S. beverage milk consumption declined by 1.8% annually from 2010 to 2019.
A look at households

We recently completed research that examined a nationally representative set of households. By our estimates:
- About 65% of U.S. households regularly consumed milk and did not substitute for plant based beverages.
- About one-fifth (20%) of U.S. households regularly consumed plant based beverages rather than milk.
- The remaining 15% consumed both milk- and plant-based beverages and substitute between the two.
We labeled the latter group “flexitarians,” which may be caused by issues such as dairy-related allergies. These results would suggest that many households purchasing alternative beverages still purchase milk.
The causes of the decline in milk consumption include more availability of substitute beverages, more eating away from home, school lunch program changes, and demographics. The proliferation in alternative beverages is well documented. There are so many beverage options for every occasion. In particular, bottled water has received attention, but bottled water is not functionally a direct substitute for most milk options such as is the case for breakfast items like coffee and cereal. Plant-based alternatives, including beverages from nuts and grains, also receive a great deal of attention and have been increasingly viewed by some consumers as substitutes for milk.
The COVID-19 reprieve
U.S. consumers are less likely to choose milk as a beverage when eating out. This was illustrated clearly in 2020 when the pandemic resulted in a major reduction in food away from home and the long-term decline in beverage consumption was largely halted. From 2019 to 2020, the decline in total beverage milk consumption was 0.1% compared to 1.8% for the prior decade. However, since consumers have started going out more frequently again, fluid consumption seems to have resumed its decline.
The exception to this trend is whole milk, with consumption that has risen each year since 2014. There are also individual milk products, including high-protein and other aspects, that have witnessed consumption gains in recent years.
Cold cereal tugs milk down
An important part of the beverage milk story has been the decline in cold cereal consumption. Cold cereal is a perfect complement to milk for most consumers, and the trend of running out the door in the morning with a grab and go breakfast has negatively affected consumption. For the entire dairy product category, one bright spot has been the move to yogurt as a substitute for cereal.
School lunch is an interesting question because it has long been a successful program that has improved nutrition across the income spectrum. The 2010 change in school lunch regulations included a move to skim milk. This was accompanied by caloric limits that make the reintroduction of whole milk difficult even if the rules are changed to allow whole milk.
One cup of skim milk is about 85 calories, while a cup of whole milk is about 145 calories. When the entire meal is limited to 600 calories, those 60 or so calories are quite valuable.
The importance of whole milk in school lunch, in addition to the obvious nutritional benefits, is that habits are made at a young age. Teaching a generation of children that beverage milk tastes like skim milk rather than whole milk is likely to have long-term consumption implications.
Demographics also play an important role. USDA’s Economic Research Service recently published a report that utilized long-term data on milk consumption trends in per capita milk consumption. The USDA report noted that about 90% of the U.S. population does not consume enough dairy products to meet federal dietary recommendations, and declining per capita consumption of milk prevents these individuals from consuming a diet consistent with those recommendations.
The study examined how people consumed milk, either as a lone beverage, on cold cereal, or in coffee or tea. As a beverage, individuals drank about 0.57 cup-equivalents of milk and milk drinks per person, per day in 2003 to 2004. That number fell to 0.33 cups by 2017 to 2018 (a 42% decline). Beverage milk consumption was down among children, teenagers, and adults.
On cereal (both cold and hot), individuals used about 0.23 cup-equivalents of milk in cereal per person, per day in 2003 to 2004. That value fell to 0.17 cup-equivalents by 2017 to 2018 (a 26% decline). Per capita milk consumption with cereal was down primarily among children.
A third way that people consume fluid milk is by adding it to other beverages like coffee and tea. In 2017 to 2018, individuals consumed about 0.07 cup-equivalents per person per day this way, which was largely unchanged from the value in 2003 to 2004.
The tie to milk checks
What does this have to do with dairy policy? Well, the Federal Milk Marketing Orders use what economists call “price discrimination” to charge a higher price in what is considered the inelastic market for beverage milk. A product of inelastic demand is one for which the quantity demanded is not responsive to the change in price. This means that, in the case of beverage milk (Class I), the price can be raised with little change in the quantity demanded. This raises total revenues.
These Class I revenues are shared across all milk pooled in a marketing order, and farmers benefit. The decline in beverage milk consumption and the growth in milk used in other products such as cheese has resulted in less Class I revenues to share.
Some have asserted that the demand for beverage milk is more elastic than in the past due to the many factors discussed in this article. If fluid demand is sufficiently elastic, then increasing the relative price using price discrimination . . . as the Federal Milk Marketing Orders . . . might be counter-productive.
The economics literature historically has estimated a very inelastic demand. Even though the demand is likely still inelastic, it is probably time to re-examine the elasticities considering demographic and other changes.


