Changing economics and shrinking margins on dairy’s home front have been a strong driver in herd demographics throughout the United States. When Hoard’s Dairyman partnered with the American Farm Bureau Federation in 1992 to create the first national census based on dairy farms holding permits to sell milk, the United States had 131,535 commercial dairy herds with an average herd size of 74 herd. Over the ensuing decade, that number gradually grew to 119 cows per herd as the number of dairy farms holding milk permits fell to 76,875.
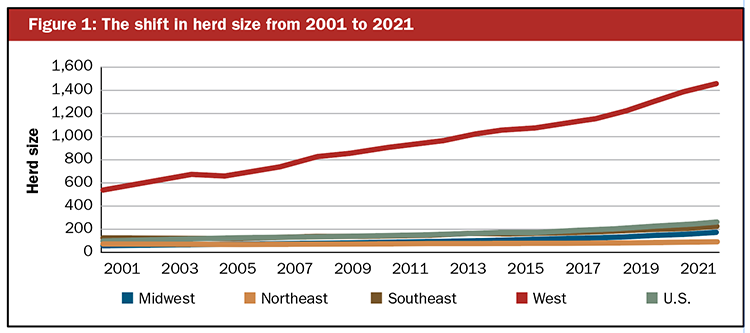
Farm Bureau and Hoard’s Dairyman continued to partner on this endeavor until 2003. Then, USDA economists found the information so valuable that they took over the data collection. The year USDA grabbed the baton, herd size inched slightly higher to reach 135 head on the nation’s 66,830 farms in 2004. By this juncture, the Western states were consistently growing their herd size by double-digit cow numbers, far outpacing the other three regions as shown in the figure.
Then came 2014.
That’s when U.S. herd size broke through the 200-head ceiling for the first time. Propelling that shift was, of course, the West, which also moved past the incredible 1,000-cows-per-farm benchmark.
During the next eight years, the West continued its skyward march in herd numbers, and the pace even picked up steam. At the same time, the Midwest and Southeast also began contributing to the faster herd size growth rates as both regions consistently began adding double-digit cow numbers in 2018. That triple charge from the three regions elevated herd size from 297 to 317 cows per herd by 2021. That same year, 29,858 herds held permits to sell milk in the United States.
A region by region look
When data was first collected in 1992, not surprisingly, the West had the largest herd size with 263 cows per herd. The Southeast was next with 115 head, then the Northeast at 61, and finally the Midwest was at the back of the pack with 51 head.
While growth has been occurring east of the Rockies, it’s the West that has changed the most since data collection began. By 2001, the region had 560 head per herd. Within an 18-year window, that number would more than double to reach 1,129 dairy cows. In the past year, the number has climbed to over 1,400 cows.
While the West and Southeast have always ranked first and second, respectively, among the regions, the Midwest tied with the Northeast at 84 cows per herd in 2004. From that point forth, the Midwest has never looked back and has held the third position. The Midwest reached the 100-cow threshold in 2008; it took the Northeast until 2014 to reach that same mark. These days, the Midwest has 225 cows per herd, and the Northeast stands at 133. Those trend lines are shown in Figure 1.
The first 1,000-cow state
For nearly a decade, New Mexico stood alone in states averaging over 1,000 cows per herd. By the time Arizona became the second state to join this unique group in 2002, the Land of Enchantment and its 175 herds already averaged 1,531 cows per herd.
Fast-forward a decade, and the herd size in New Mexico climbed remarkably to reach 2,350 cows while Arizona remained a solid second with 1,709. By 2011, there were three more states with over 1,000 cows, with Nevada herds being home to 1,450 cows, California at 1,056, and Idaho with 1,005 as shown in Figure 2.
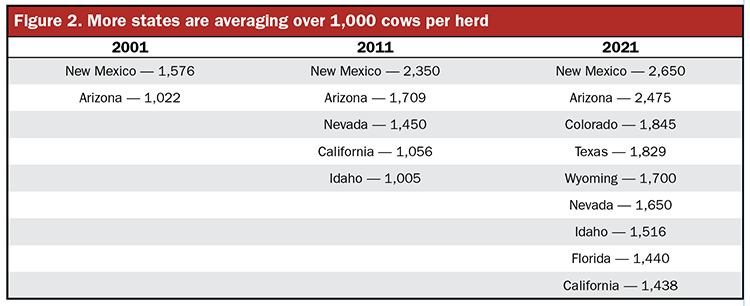
These days, New Mexico and Arizona are a pair when it comes to herd size, with 2,650 and 2,475 cows, respectively. In addition to these two juggernauts, Nevada has grown to 1,650 cows, Idaho to 1,516 cows, and California to 1,438 cows. Four more states have since joined the group: Colorado, Texas, Wyoming, and Florida, and all of them have over 1,400 cows per herd.
Of this group, Florida is the only one that does not call the West home. It averages 1,440 cows, just two less than California. Soon, South Dakota will make the 1,000-plus cows per herd group a perfect 10. At the moment, the Mount Rushmore State averages 945 cows.
Bigger farms make more milk
In 2002, there were only 1,256 farms over 1,000 dairy cows, based on USDA data. This group accounted for just 29% of the nation’s dairy cows 20 years ago. By 2017, there were 1,953 herds with over 1,000 head. While this 1,000-plus category only added 697 herds during the ensuing 15 years, clearly, herd size grew significantly as the group collectively became home to 55% of the nation’s dairy cows, according to USDA’s Census of Agriculture data collected once every five years.
As this took place, herds with under 100 cows fell dramatically, moving from 73,725 in 2002 to 40,548 by 2017. As a result, this group’s share of the dairy cow herd shifted from 29% down to 13%.
One co-op’s snapshot
Dairy Farmers of America (DFA) also offers some insight to America’s shifting cow numbers. At its annual meeting in March, the co-op shared that nearly 7,000 of its member farms produce 57.1 billion pounds of milk. That represented 25% of the nation’s total milk production in 2021.
It took just 108 of those farms to produce 14.3 billion pounds or 25% of the co-op’s total. Average herd size in that group was 5,576 cows. Fourteen years earlier, the first time the cooperative began tracking this quartile data, there were 140 farms in that category that averaged 3,069 cows. In both instances, that group accounted for just 1% of the co-op’s membership.
In 2021, the next group that produced 25% of the co-op’s milk included 205 farms with an average herd size of 2,952 cows. In 2007, that same group counted 374 farms in its ranks and averaged 1,177 cows per herd. In both snapshots of time, the second 25% of milk production came from 3% of the co-op’s membership.
The group of farms that made the next quarter of DFA’s milk counted 475 farms in its ranks in 2021. That number was much larger 14 years earlier when tracking began, as 1,462 herds were in the same category in 2007. Not surprisingly, herd size grew dramatically during that time, eventually reaching 1,275 cows, up from 322. In 2021, just 7% of the membership filled the third 25% category of milk production. That number had been 13% in 2007.
The final group is large in numbers but small in herd size. In 2021, there were 6,160 farms with an average herd size of 98 cows that rounded out the co-op. Just 14 years earlier, that herd size was nearly half with 55 cows per herd in the group of 9,473 dairy farms.
What about the future?
What the numbers might look like a decade from now is uncertain. However, given the trend lines, it’s safe to say that the national herd size could push past 400 head and maybe onward to 500-head levels.


