Bill challenged me at a meeting about his high-producing Holstein herd (over 29,000 pounds of milk) with the question, “Do you have data that allows me to evaluate my herd to the national dairy herd?”
New data that may be helpful to Bill and others are contained in the four tables. Dairy Records Management Systems in Raleigh, N.C., responded to our request to summarize 2016 milk production and milk component levels in Dairy Herd Information (DHI) herds sent to their processing center.
Look at lactation curves
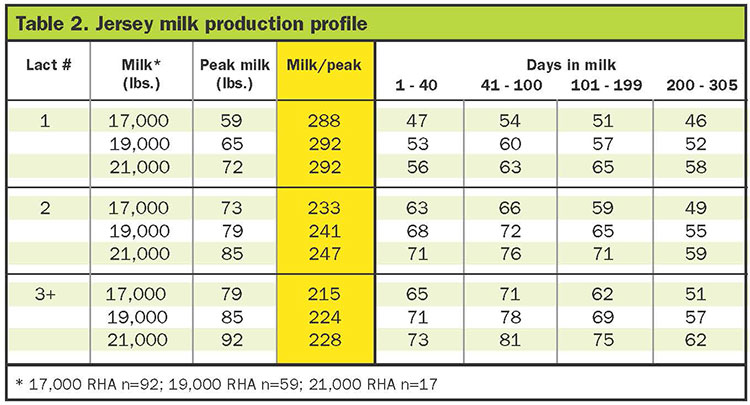
Milk production levels by lactation number allows us to evaluate each group of cows based on days in milk (finding weak links). If heifers are not properly grown and/or at optimal size at calving, first-lactation cows could divert nutrients to growth, which could reduce milk yield.
If second-lactation cows are below herd average targets, sophomore slump may have occurred (first-lactation cows produced more milk in their first lactation compared to the second lactation). Second-lactation cows may not recover optimal body condition scores for the next lactation because of competition with older cows, or health issues leading to lower milk yield.
Third and greater lactation cows that are below target levels could reflect poor management of dry cow transition mastitis, too low or too high body condition scores, lameness, or other management concerns.
The guideline of DHI peak milk times 250 should equal rolling herd average (RHA) milk appears to be as valid today as it was 20 years ago. For farms that can record true peak milk due to daily recording milk weights, the rule of thumb is RHA milk is equal to true peak milk yield times 200. The DHI peak milk in our data compared to lactation milk yield varied in calculated constants by parity or lactation number (see tables 1 and 3).
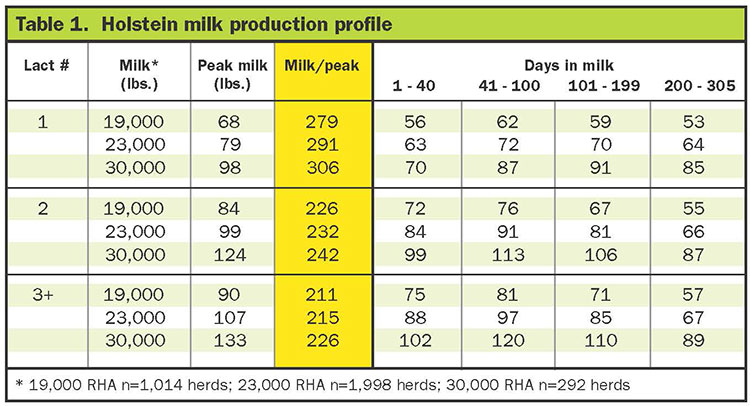
For first-lactation cows, the constant was about 290, the second-lactation cow constant was about 230, and the third-plus-lactation cows constant appeared to be about 215.
Holstein and Jersey peak milk constants associated with total lactation yields were similar based on lactation number or parity, which is interesting.
Milk components show
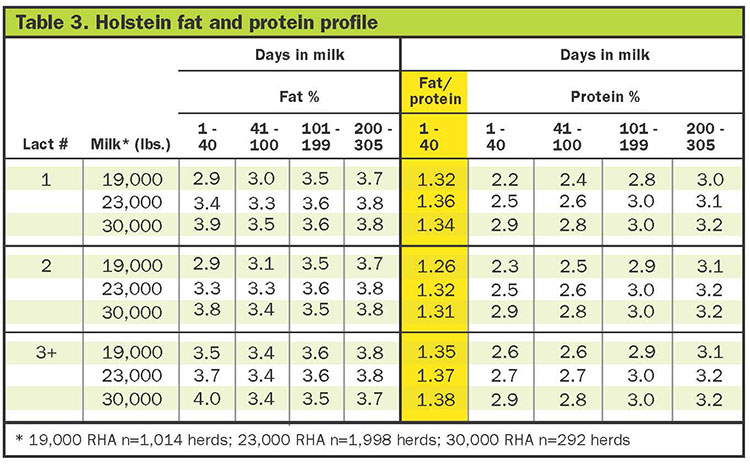
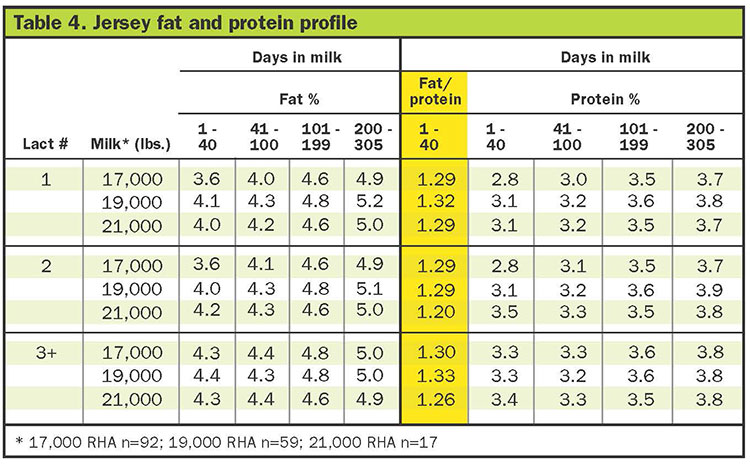
Looking at the relationship of milkfat to true milk protein ratio is breed specific. Milkfat and milk protein percentages by days in milk and lactation numbers were surprising.
Higher milkfat-to-protein ratio from 1 to 40 days in milk can reflect fat mobilization to provide added energy for milk production, shortage in dry matter intake, and/or low true milk protein percentages. Cows with higher milkfat test are at risk to develop ketosis, reduced fertility, and lameness (caused by reduced fat pad in the hoof).
If true milk protein percent is deficient in early lactation, amino acid levels are not adequate for the mammary gland to synthesize milk protein. An amino acid shortage could be related to low dry matter intake, poor dry cow transition diets, unfavorable amino acid profile from rumen undegraded protein (RUP) supplements, and/or low metabolizable protein intake.
Holstein ratios of milkfat to true milk protein varied with the top values appearing in the highest producing herds in both Holstein and Jersey breeds (30,000 pounds for Holstein herds and 21,000 pounds of Jersey herds). The higher ratio could reflect more body fat mobilization, greater dry matter intake, added fat feeding, or better management. Average milkfat test for Holsteins was 3.81 percent in the 2018 DHI data.
Jersey milk components followed a similar trend with the highest ratio reported in the top producing herds at 3.4 for 21,000-pound herds and 3.1 for herds at 15,000 pounds of milk.
In both breeds, milk components were below breed average in the first 100 days after calving. In milk markets that pay for pounds of milk components, additional milk income could be achieved during this time period. Lower producing herds had lower milk components than high-producing herds. This observation challenges the comment, “High production leads to lower milk components.”
More to look at
Study the tables to see if you discover other applications. Several questions include:
- Does your herd fit the profile for milk production and milk components listed in the tables?
- Does your herd “curve jump”? If groups of cows start out at higher or lower producing herd levels and then change at 100 to 200 days or later. Why did this occur on your farm?
- Why is milk true protein test low in early lactation for both breeds and all levels of milk production?
- Does your dry cow program limit dry matter intake and microbial production of amino acids and volatile fatty acids (energy)?
- Should you consider adding rumen inert fat and/or rumen protected amino acids in early lactation?
- Is your heifer feeding and management program limiting production in first lactations?
- How would the milk, values change if milk yields were based on an energy or fat-corrected milk basis?