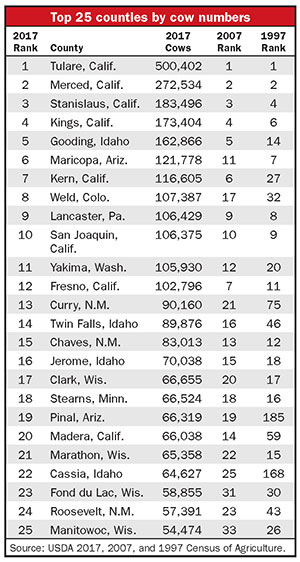
With over 500,000 cows in the most recent U.S. Census of Agriculture, Tulare County built upon its title as the nation’s largest dairy county. To put those numbers into perspective, if the California dairy hotbed were a state itself, Tulare would rank sixth, wedged between Texas and Minnesota with 5.3 percent of the nation’s cows.
Not only did Tulare County maintain its stronghold as the nation’s most populated dairy county, it also expanded its lead over second-place Merced County. Over the past five years between agriculture census surveys, the California dairy juggernaut added 11,000 cows while Merced shed nearly 13,000 head of milking bovines.
That’s a far cry from 1997 when the dynamic duo stood No. 3 and No. 5 in the entire country. At that time, San Bernardino had 185,249 dairy cows and Riverside had 113,719 head. The only counties that outranked those two were Tulare, Merced, and Stanislaus. Over the past two decades, the two aforementioned counties lost 208,000 head. Tulare, with 278,000 head in 1997, easily absorbed those dairy numbers.
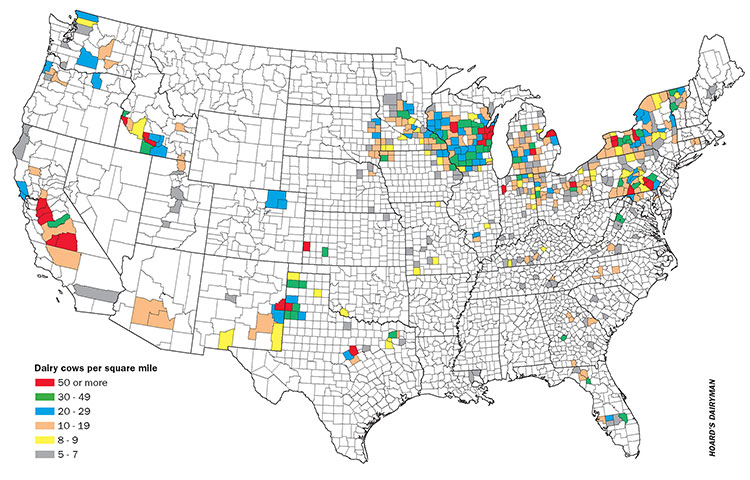
The intensity of the nation’s dairy cow numbers, defined by dairy cows per square mile, can be observed in the map below. Wisconsin, not California, is home to more counties with over 50 cows per square mile — seven versus five. Idaho ranks third with three, while four other states each have two counties highlighted in red. Those states include New York, Texas, Michigan, and Pennsylvania. It is not a coincidence that each state respectively ranks among the top seven dairy states.
The reason Wisconsin has more counties with greater dairy cow intensity is partially due to smaller surface area found in county jurisdictions east of the Mississippi River. In particular, six of the Badger State’s seven most densely populated counties are located in the northeast portion of the state. Due to already having one of the most densely populated dairy regions on the planet, the six-county group only added 2,700 dairy cows over the past five years. However, over the past 20 years, those same counties added 71,000 dairy cows.
During that same time horizon, the Texas Panhandle and eastern New Mexico experienced similar growth. That ten-county cluster has been led by New Mexico’s Curry County. It charged into the No. 13 position with 83,013 cows. In 1997, the county was hardly on the dairy radar ranking No. 75. Neighboring Roosevelt County climbed to the No. 24 spot after standing at No. 43 two decades ago. While small in surface area, Hartley and Parmer Counties, directly across the border in Texas, ranked No. 30 and No. 35, respectively, in the most recent USDA census. Those counties were not even in the top 500 dairy counties 20 years ago.
In all, 31.5 percent of dairy cows reside in the top 25 dairy counties. When expanding that list, 43.5 percent of the nation’s dairy cows resided in the top 50 counties.
The map above depicts current cow densities. The numbers (1 to 25) found on the map correspond to the top 25 dairy counties show in the table. The color scaled at the bottom of the map details cows per square mile.


