Milk prices were too low for too long. That sums up the serious economic consequences in the countryside as 8.8% of all dairy farms holding permits to sell milk left the business last year. Some of those farms departed because the economic tide of negative cash flow carried them out to sea, while others pulled the plug before hard-earned equity vanished forever from their balance sheets.
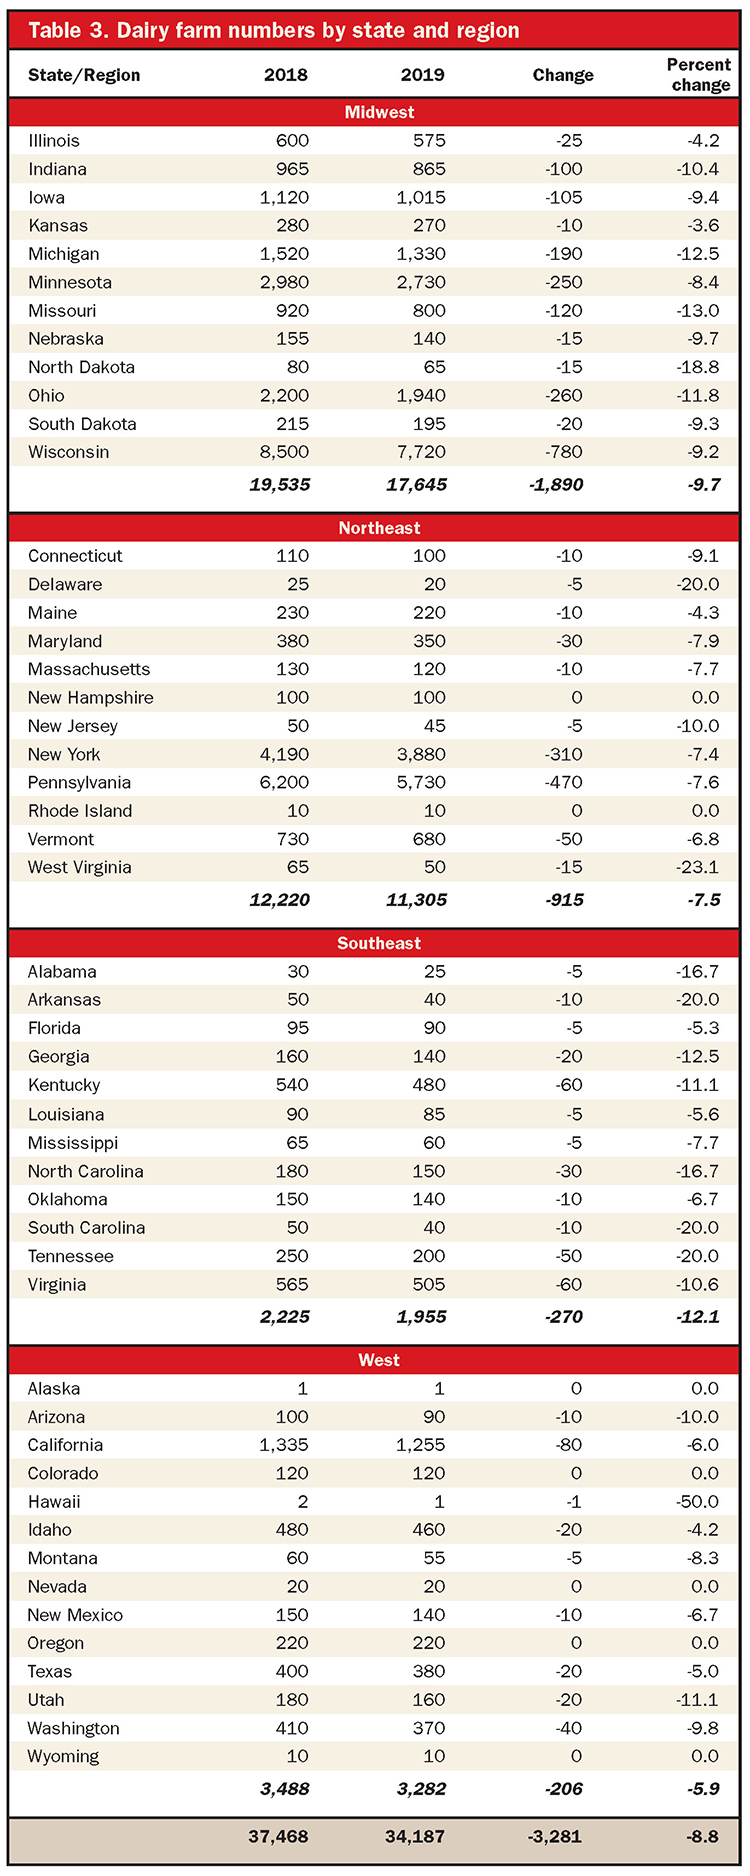
Regrettably, all areas of the country were impacted as three regions, shown in Table 3, posted the largest percentage losses since permit tracking began in 1992. During the past year, the Southeast lost 12.1% of its farms, the Midwest had 9.7% exit, and the West saw 5.9% of all dairies call it quits.
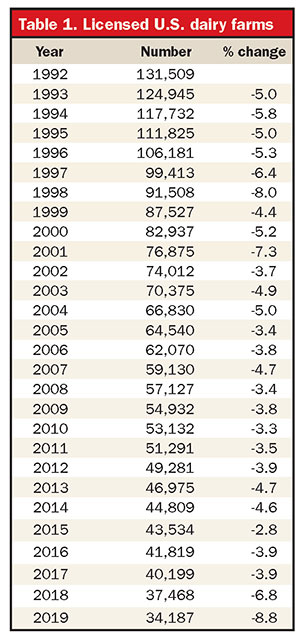
The Northeast was the only region not to post record losses. While that region had 7.5% of its farms shutter milk pumps, the Northeast lost 7.7% of its farms in 1998. It’s no coincidence that the U.S. lost 8% of its dairy farms that year, as shown in Table 1, making it the second-largest percentage loss on record.
Even though dairy cows and farms continued to consolidate into clusters, the top 10 dairy states lost more farms than the remaining 40 states. This is an unusual situation when evaluating long-term trends. Overall, the top 10 dairy states lost 8.9% of its farms, while the rest of the country lost 8.2%.
Of the top 10 dairy states based on farm numbers, the following were hit especially hard (listed based on dairy numbers): Wisconsin, down 9.2%; Ohio, down 11.8%; Michigan, down 12.5%; Iowa, down 9.4%; Indiana, down 10.4%; and Missouri, down 13%. Losses were slightly lower in: California, off 6%; New York, down 7.4%; Pennsylvania, off 7.6%; and Minnesota, down 8.4%.
Table 1 details the 28-year history of dairy farms holding permits to sell milk. Since 1992, the number of licensed, or so-called commercial, dairy farms has declined by 97,322, from 131,509 to 34,187. That’s a 74% drop during that time.
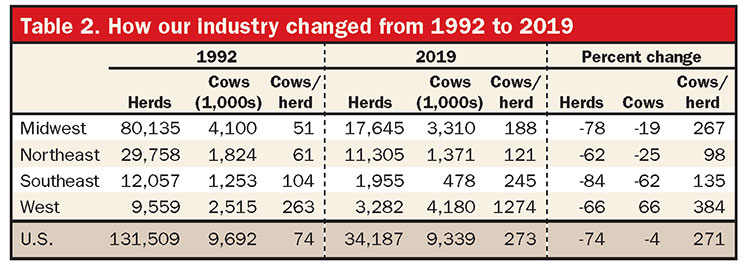
Table 2 provides an overview of the last 28 years of change. Nationally, average herd size has grown 271%, from 74 to 273 cows. Over the past year, herd size grew from 251 cows to 273 cows, up a record 22 head.
Regionally, the West (+384%) and the Midwest (+267%) have seen the largest percentage gains in herd size. Since 1992, herd size in the Southeast grew at half the pace found in the Midwest, and the Northeast grew at one-third the figure posted by the Midwest.
Western herds added 82 cows per herd last year, bringing its average to 1,274. That represented stronger growth in herd size compared to the prior year’s 63 cows. The three-year change of 82, 63, and 40 cows surpassed the growth that took place from 2012 to 2014, when herd sizes grew by 49, 33, and 47 cows with each advancing year.
For the 15th time in the past 17 years, the Southeast had the largest share of farms calling it quits (Table 3). The Midwest closely followed the Southeast by losing 9.7% of its dairies. Overall, the Midwest’s reduction in farm numbers was the region’s highest percentage loss since 2001’s 8.5%. In that era, Hoard’s Dairyman partnered with the American Farm Bureau Federation to obtain milk permit data. These days, USDA’s National Agricultural Statistics Service (NASS) tabulates the information. These numbers are a snapshot in time. For example, in February 2020, Wisconsin had 7,258 dairy farms.