June 2020 Article
Goeser is the director of nutritional research and innovation with Rock River Lab Inc., Watertown, Wis., and adjunct assistant professor, dairy science department, University of Wisconsin-Madison.
Alternative forages, such as cereals, warm-season grasses like sorghum, and mixed blends of annual grasses and legumes (sometimes dubbed cocktail mixes), continue to be a consideration for many dairies. Winterkill in the Midwest and Northeast and costly water rights in the South and West have spurred this conversation as those forages offer intriguing crop production costs per acre with lower seed cost.
There are many different ways to feed dairy cows. Warm- and cool-season grasses, legumes, and other plant varieties can all serve as nutritious options for dairy diets. That being said, comparing the different options proves difficult as it is often tough to account for all the needed inputs to compare cash flow with Option A versus Option B.
When evaluating the economics and management strategies of alternative forage programs, an analysis should break down input costs and economic returns. There are three foundational inputs that need to be accounted for here.
Blueprints can help avoid missing critical details. And similar to how your farm might employ engineers and architects to lay out a blueprint to evaluate a new barn or building, you should lay out a blueprint for how your management team evaluates alternative forages.
In the past, Milk2006 has served as the blueprint to nutritionally rank forages, but it does not account for crop production costs per acre. The Milk2006 index is now outdated, and most nutritionists have abandoned it due to more advanced dairy nutrition measures available.
This disparity became more clear when collaborating with Randy Shaver, Joe Lauer, and Bruce Jones on UW-Madison Division of Extension’s seed corn cash flow projection tool available here: on.hoards.com/corncalculator.
There is a path forward, though. Here is the blueprint to work through with your advisory team.
Understanding inputs
As mentioned, there are three foundational areas that need to be covered by your leadership team when discussing forage budgets.
The prerequisites for sound partial budgeting include:
- Crop production costs per acre.
- Yield per acre including acreage needed to feed herd.
- Dairy cattle performance and economic projections based on nutrition analysis and feed costs.
Your consulting agronomist and/or seed adviser can help determine crop production costs per acre. If you need a worksheet to follow, reference the Iowa State Extension article found at on.hoards.com/ISUcropproduction for an example.
Forage dry matter yields are the next factor that needs to be accurately estimated for cash flow projections. Work with your harvesting crew to accurately estimate yields.
Do not forget to connect yield per acre to the total acres needed to feed the herd. This is an often overlooked aspect to forage partial budgets. Forage-growing acres can rise or fall depending on needs in the diet.
Lastly, dairy cattle performance projections and feed cost impacts considering alternative forage inclusion are necessary. Your nutritionist will be able to project performance assuming replacement of current forage with the alternative forage, pound for pound.
In a more complex projection, your nutritionist may balance the diet based on other parameters (undigestible neutral detergent fiber [uNDF]) and forage to concentrate ratio. In those cases, nonforage feed costs may change.
Either way, dairy performance projections rely on example forage analyses from a reputable source. Work from forage analysis for crops grown on your farm if possible.
If not, reference your commercial forage analysis laboratory’s database for nutritional value. That’s preferable to a sample nutrition analysis provided by a seed adviser. Try to match location and time period as closely as possible to your farm’s situation.
For an example, I logged into the client portal at www.rockriverlab.com and used the “statistics” tool. Note, users can obtain credentials and database access for most forage labs free of charge.
After logging in to Rock River’s site as an example, users are able to select date ranges, nutrition parameters and specify sample descriptions (for example, rye) to query. The results for my example are shown in Table 1. These represent the average nutrition analysis values for samples with descriptions matching what was specified.
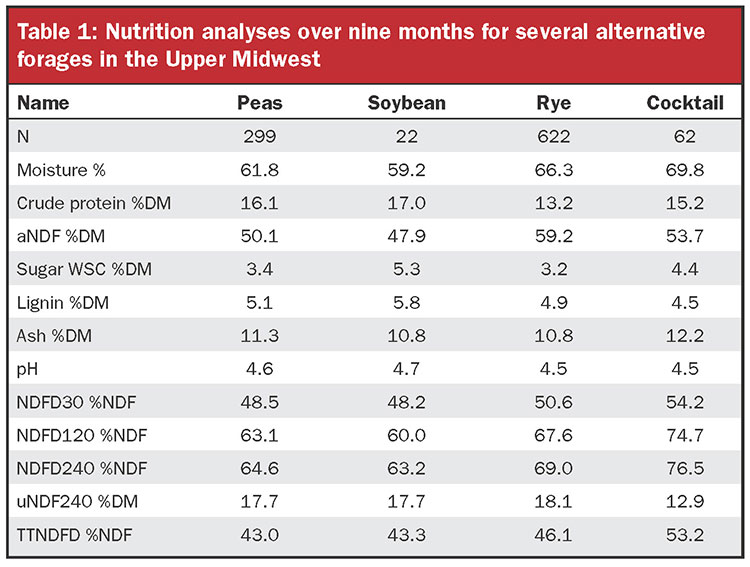
With Table 1 forage analysis specifications in hand, I was able to run several comparative diets and recognize that each of these alternatives yielded slightly less milk per cow when replacing average alfalfa, pound for pound at similar dry matter intakes. However, this does not equate to these alternatives resulting in negative cash flow relative to alfalfa. The crop production costs and yield need to be considered to round out the budget.
Build your blueprint
Bring your nutrition, agronomy, and seed consultants to the table. Cover the three core inputs (crop production cost, dry matter yields, and cattle performance) for realistic, alternative forage cash flow projections on your farm. Remember that milk yield economic impact must be balanced against crop production costs per acre and total acres needed to feed the herd.