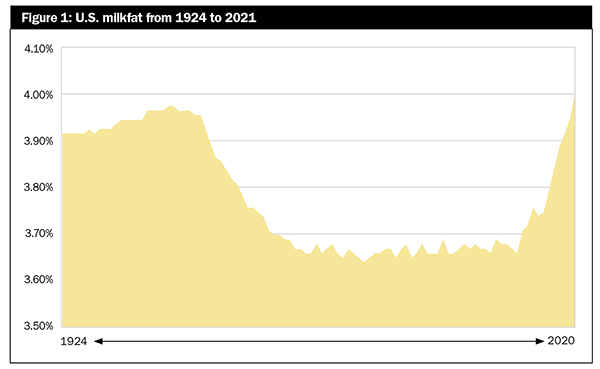
Butterfat composition in the national bulk tank has been on a meteoric rise over the past decade. Before that, according to USDA data, butterfat levels held in a tight window of 3.65% to 3.69% from 1966 to 2010.
After four decades of relative stability or stagnation — depending on one’s perspective — a breakout took place as butterfat moved to 3.71% in 2011, busted out to 3.84% in 2017, and forged ahead to 3.92% in 2019. Last year, butterfat reached a new peak of 4.01% and pushed past the previous historic high of 3.98% last recorded in 1944 and 1945. This trajectory is illustrated in Figure 1.
Demand continues to build
That growth in butterfat has taken place for several reasons. For starters, consumers continue to demand more full-fat dairy products packed with flavor. This also has coincided with the changing science that now supports saturated fats in healthy diets. As these story lines have unfolded, cheese consumption jumped past 39 pounds per capita last year. By the time 2022 comes to a close, Americans could easily be consuming 40 pounds of cheese per person. Just 20 years ago, that number stood at 30 pounds.
Butter is back, too. This fall, butterfat prices pushed past historic highs as retailers continued to buy butter in order to ensure stocked store shelves heading into the holiday baking season. Despite those lofty prices, butterfat inventories remained short this fall.
Simply said, consumers are eating their dairy products as the $59 billion dairy category also stands at the highest level, on a per pound basis, since 1959. Indeed, consumers ate 667 pounds of milk in the form of dairy products last year. That’s according to USDA data, and the number is up 64 pounds from just a decade ago when it stood at 603 pounds.
Those are some of the demand factors. Then there’s the producer push and the processor pull.
In many regions, farmers still face supply caps known as base excess programs. Those programs place limits on the pounds of milk shipped from each farm. However, in nearly every case, those same base excess plans place no limits on the pounds of solids — largely butterfat and protein — shipped from each farm. Hence, dairy producers and their farm advisers have developed strategies to grow butterfat and protein production. That dynamic shows up in the major shift in component percentages cited earlier.
Fluid-based orders lag
The most easily and longest tracked component is butterfat, as protein is a relative newcomer in the dairy industry. While the 4.01% butterfat in the national bulk tank represents a new threshold for the U.S. dairy community, not all regions have shipped similar components. In fact, milk check payment structures, which vary region by region, have provided significant incentive or disincentive to shift focus on milk solids.
Due to dynamic work by a group of federal order administrators, we can have a deeper look into this milk solids story via a data set of butterfat levels from 2000 to 2021. This data series was selected for two reasons. For starters, it takes us back to the start of the new century. Secondly, and perhaps more importantly, we can gain insight from the pre-2010 era when national butterfat levels held in a tight range of 3.65% to 3.69% before the butterfat transformation.
Three federal orders in the southeastern U.S. and the Arizona order are the lone holdouts in growing butterfat output, largely due to the major share of their milk being marketed in the fluid category. The Florida federal order, which had an 82% share of its milk going to Class I beverage sales, provides the most striking example. From 2000 to 2021, butterfat levels held in a rather narrow window of 3.57% to 3.7%. In short, there has been little change in Florida’s federal order.
The Appalachian and Southeast orders are twins of sorts on the butterfat and Class I fluid milk front. When it comes to fluid milk sales, the two orders held 71% and 68% of the Class I share last year, respectively. When it comes to butterfat, both were under 3.7% from 2000 to 2010; from 2011 to 2017, the two orders bounced between 3.66% and 3.76%; and in the last four years, both moved into the 3.8% range. Those values are still well under the national average of 4.01%.
Arizona, with significant fluid milk and powder markets, actually had component levels below those in both the Appalachian and Southeast orders. Since the turn of the century, Arizona was well under the national average butterfat level at every comparable checkpoint. In fact, 2019 was the very first year the Arizona order moved past 3.7%. From 2000 to 2018, butterfat percentages ranged from a low of 3.49% in 2009 to 3.66% in 2018.
The butterfat barons
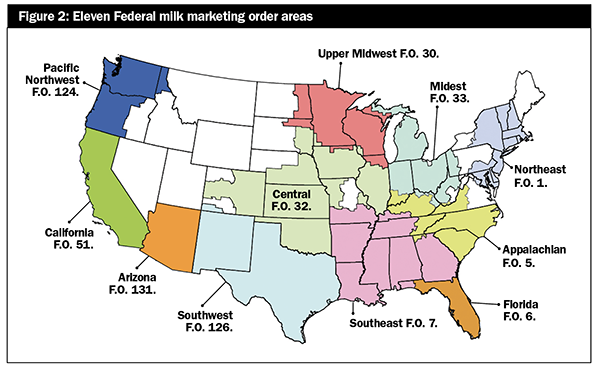
Among the remaining federal orders, six have full data sets, and two of those Federal Milk Marketing Orders stand out above the others. Those barons include the Southwest order based in New Mexico and fast-charging Texas, which now ranks fourth among all states for milk production. That order pushed past 4.07% butterfat in 2020 and led the nation last year with a 4.13%. The Southwest order has a 32% Class I market share.
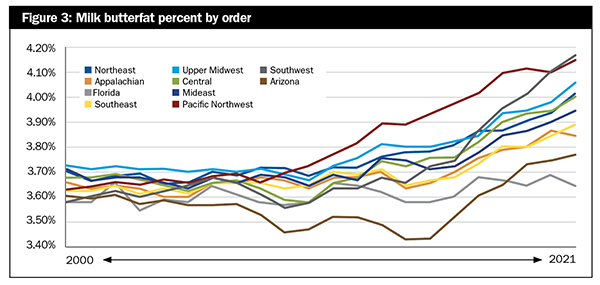
Equally impressive is the Pacific Northwest order. In 2018, it became the first order in the nation to move past 4% butterfat. That was two years before the Southwest. Covering the entire state of Washington, the lion’s share of Oregon, and northern Idaho, this region actually led the nation in component levels every year since the butterfat run began . . . until 2020, when the Southwest order tied it at 4.07% and then overtook it in 2021. That year, the Pacific Northwest ranked second among all orders at 4.11% butterfat. The Pacific Northwest order has a 22% Class I market share.
Outside of these two leading butterfat regions, the Upper Midwest federal order is anchored by the cheeseheads of Wisconsin, where 90% of the milk goes into cheese production. That order pushed past the 4% threshold for the first time in 2021. It had been making a steady climb, first moving past 3.8% butterfat in 2013 and then 3.9% in 2018.
The Northeast, Central, and Mideast orders largely look the same as the Upper Midwest. However, each lags slightly in the marathon to move past 4% butterfat. If one were placing a trifecta bet in this butterfat race between the three orders, the Northeast was the first to move past 3.8% butterfat in 2016; next came the Central order in 2017; and finally, the Mideast in 2018. The Northeast and Central both crossed the 3.9% mark in 2019, but it took until 2021 for the Mideast to do the same.
The final order in the group is California. Formed in 2018, only the most recent three years have complete butterfat data: 3.86% in 2019, 3.87% in 2020, and 3.92% in 2021.
The protein push
Six orders also have protein statistics dating back to 2000. The protein story is largely the same, with the Southwest and Pacific Northwest leading the pack. The Pacific Northwest was the first to move past 3.1% protein in 2009 and the Southwest matched it in 2011. The Pacific Northwest leapt past 3.2% protein rather quickly in 2013, but it took the Southwest until 2017 to do the same. By 2021, both moved past 3.3% with the Southwest taking the first-ever lead at 3.33% protein. That means that the Southwest holds the honor of having the most nutrient-dense milk in the nation with a 4.13% butterfat and a 3.33% protein.
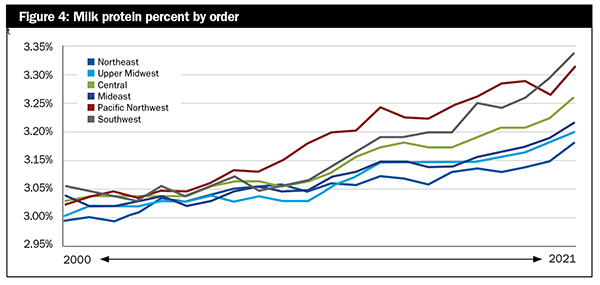
While the data set is limited in California, in 2021, The Golden State did hold the honor of having the third highest protein level at 3.25%. Among the remaining orders, the Central order closely mirrors California at 3.24% protein. It’s the only other order over that 3.2% threshold.
The Central order in America’s Heartland first moved past 3.1% in 2012. The very next year, both the Mideast and Upper Midwest matched that mark of 3.1% protein. Both are poised to move past 3.2% in 2022, as they stood at 3.19% and 3.17%, respectively, last year.
Of the orders tracking protein, the Northeast has the lowest levels in the nation. From 2000 to 2020, this grouping of 11 states shipped milk with protein levels in a tight range of 2.99% to 3.11%. While there was a slight upward trend over that time, the region made the biggest one-year movement on a percentage basis when it moved from 3.11% to 3.15% from 2020 to 2021.
As for the future, the long-term demand trends for dairy products indicate that butter, cheese, and other high component dairy products will continue to grow. Given that projection, the upward climb in both butterfat and protein levels will surely continue among the federal orders based on multiple component pricing.


