Economists like to use history as a guide to forecast future conditions such as grain prices, farm incomes, input costs, and crop yields. Dairy farmers can do the same with respect to forecasting their farm’s monthly mailbox price ($ per cwt.).
A DIRECT LINK
The MPF system is used to quantify the historic relationship between your farm’s mailbox price compared to the market-generated monthly announced Class III and IV milk prices. Once this historic relationship has been quantified, the previous day’s CME Class III and IV future contracts settlement prices help forecast your mailbox price for the next 12 months. The reason that this method can be used is due to the Class III and IV futures contracts being cash settle contracts to easily compare USDA’s monthly announced Class prices.
The only data needed from producers to obtain farm-specific monthly mailbox price forecasts are the mailbox prices actually received by your farm. A minimum of three years or 36 months of data should be used to calculate your farm’s prediction. As always, more data provides a more accurate forecast. In addition, if the producer knows each month’s average milk fat and protein content of their farm’s milk, the forecasting accuracy of the statistical model will be improved by using this data to explain their mailbox price.
As an example of how to use the MPF system, we use this tool to obtain 12-month forecasts of average state/regional mailbox prices for New York, Michigan, Wisconsin, Florida, New Mexico, California, and the Federal Milk Marketing Order (FMMO) system as a whole.
(Note that for this analysis we are assuming the California milk pricing system is still in effect over the forecast period. California is scheduled to join the FMMO system on November 1, 2018.)
For each of these analyses we use monthly state and region average mailbox prices encompassing the January 2005 to May 2018 period, USDA’s Class III and IV announced prices, and Class III and IV futures settlement price data as of the end of business on July 19. Because we did not have monthly milk quality data, we did not include average milkfat and protein information in the analyses. We did include in our statistical model as to which quarter of the year a mailbox price applies so as to account for seasonal differences in milk quality and other factors that impact milk’s value.
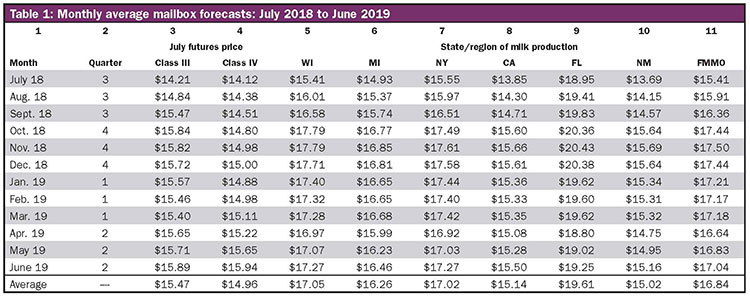
In Table 1, we present the data used to generate our forecasts. The third and fourth columns of this table contain the Class III and IV futures settlement prices as of the end of July 19 trading.
The average Class III settlement price was $15.47 per cwt. compared to $14.96 per cwt. for Class IV milk. The low price for both announced price futures contracts were obtained in July 2018 and the high in June 2019. For comparison, over January to June 2018 the average USDA announced Class III and IV prices were $14.41 per cwt. and $13.67 per cwt., respectively.
In Columns 5 to 11, we present our forecast mailbox prices. We see that for Wisconsin, the average forecast mailbox value was $17.05 per cwt. That compares to Florida’s average high of $19.61 per cwt. and the low of $15.02 per cwt. for New Mexico. For the Federal Milk Marketing Order, the average forecast mailbox value was $16.84 per cwt.
The high value for Florida reflects the relatively high Class I milk utilization compared to other regions. The low New Mexico average forecast mailbox price reflects the importance of Class III and IV milk utilization in the Southwest Federal Order and the dominance of cooperatives in the order.
The Mailbox Price Forecaster tool also can compare our forecast results with previous average mailbox prices. While space does allow us to print those results, it can be a fruitful exercise. For the FMMO as a whole, we forecast a 50-cent per cwt. improvement in average mailbox prices. The Wisconsin forecast for January to May 2019 was $1 per cwt. greater than the January to May 2018 observed mailbox price values.
PREDICT YOUR PRICES
In summary, dairy farmers can now generate estimates of their farm specific mailbox prices using web-based software. These estimates can help to provide predictions of future cash flows.
When combined with estimates of future feed costs, forecasts of income-over-feed costs will also be able to be obtained (software to estimate future feed costs similar to your mailbox price is under development). Feel free to contract Brian Gould via email at bwgould@wisc.edu for more information concerning this forecasting system.